CompTIA Project+ Certification - (PK0-005) Exam Questions
537
Total Questions
SEP
2025
Last Updated
1st
1st Try Guaranteed

Experts Verified
Width:
45%
Question 11 Single Choice
Alicia, a project manager, has a project with a high degree of uncertainty. It is a large and complex project which is very expensive. She wants to determine the contingency buffer. Which of the following would be best used for creating this estimate of the buffer?
Explanation

Click "Show Answer" to see the explanation here
OBJ 1.6: EMV (Expected Monetary Value) is a way to calculate an average outcome in situations where there is uncertainty. To calculate the EMV, we need to know the probability an event will occur and the impact of the event on the overall cost. The probability and its monetary impact are multiplied to reveal the EMV. The EMV is used to determine the contingency buffer needed for the project which is particularly helpful for large, expensive projects with many risks. Monte Carlo analysis uses simulations to assesses the likelihood of a project estimate covering actual project expenses. You may also use it to calculate contingency and management reserves, but it isn't as appropriate as an EMV for this project because of the high level of uncertainty. Top-Down and Bottom-Up estimations are general estimation techniques and are not specific to estimating contingency buffers. For support or reporting issues, include Question ID: 649498cd074ea9586cd7a1cf in your ticket. Thank you.
Explanation
OBJ 1.6: EMV (Expected Monetary Value) is a way to calculate an average outcome in situations where there is uncertainty. To calculate the EMV, we need to know the probability an event will occur and the impact of the event on the overall cost. The probability and its monetary impact are multiplied to reveal the EMV. The EMV is used to determine the contingency buffer needed for the project which is particularly helpful for large, expensive projects with many risks. Monte Carlo analysis uses simulations to assesses the likelihood of a project estimate covering actual project expenses. You may also use it to calculate contingency and management reserves, but it isn't as appropriate as an EMV for this project because of the high level of uncertainty. Top-Down and Bottom-Up estimations are general estimation techniques and are not specific to estimating contingency buffers. For support or reporting issues, include Question ID: 649498cd074ea9586cd7a1cf in your ticket. Thank you.
Question 12 Single Choice
What is a key difference between a defect and an issue?
Explanation
Click "Show Answer" to see the explanation here
OBJ 3.1: An issue is something that is outside of the team’s control. A defect is a failure to meet the requirements. The failure can be remedied by either changing the product or changing the requirements. For support or reporting issues, include Question ID: 64c96f2c055324cddd78980d in your ticket. Thank you.
Explanation
OBJ 3.1: An issue is something that is outside of the team’s control. A defect is a failure to meet the requirements. The failure can be remedied by either changing the product or changing the requirements. For support or reporting issues, include Question ID: 64c96f2c055324cddd78980d in your ticket. Thank you.
Question 13 Single Choice
What is the third step in developing systematic Organizational Change Management (OCM)?
Explanation
Click "Show Answer" to see the explanation here
OBJ 2.5: Facilitating the transition is the third step in creating systematic Organizational Change Management (OCM). It should involve training and lots of support from within the company. Identifying groups that will need to do things differently is the first step. Identifying these groups first gives a good view of how large the resistance to the change may be because people who will have to do things differently are the most likely to resist change. Identifying what people will need to do differently is the second step because it allows the development of plans to overcome objections to change and provide adequate training. People often resist change when they aren’t given training. Monitoring and reinforcing adoption is the last step. Having trained the individuals and offered support, management and the team can check in on people who are impacted to see if they are having difficulties and require greater support. For support or reporting issues, include Question ID: 64c2c227168ac527115733b9 in your ticket. Thank you.
Explanation
OBJ 2.5: Facilitating the transition is the third step in creating systematic Organizational Change Management (OCM). It should involve training and lots of support from within the company. Identifying groups that will need to do things differently is the first step. Identifying these groups first gives a good view of how large the resistance to the change may be because people who will have to do things differently are the most likely to resist change. Identifying what people will need to do differently is the second step because it allows the development of plans to overcome objections to change and provide adequate training. People often resist change when they aren’t given training. Monitoring and reinforcing adoption is the last step. Having trained the individuals and offered support, management and the team can check in on people who are impacted to see if they are having difficulties and require greater support. For support or reporting issues, include Question ID: 64c2c227168ac527115733b9 in your ticket. Thank you.
Question 14 Single Choice
Fedson Foods is experiencing dramatic growth in sales. Their current system for tracking customer accounts is no longer enough. Since the company is going to be purchasing a new software system, they want one that will also allow them to gather and track feedback as well. Which of the following software solutions will best address all of the company's needs?
Explanation
Click "Show Answer" to see the explanation here
CRM (Customer Relationship Management) software help manage customer interactions. They allow companies to create and maintain relationships with customers to improve the company’s profits by increasing customer loyalty. They can help track customer transactions, feedback, and preferences to make the customer experience more personal. They also allow companies to gain data needed to improve marketing and products. EDMS (Electronic Document Management System) software, are also known as RMS (Record Management Systems) software. These types of software help with the creation, tracking, and sharing of information, but also allow companies to create and edit workflows to improve the efficiency of processes. CMS (Content Management System) software helps create content for websites and other media which can be quite complex. A good CMS provides a clear interface event when the background processes are quite complex. This allows companies to produce better content more quickly and users to more easily use the interfaces that are created. ERP (Enterprise Resource Planning) software helps manage operational workloads including accounting, supply chain activities, procurement processes, and resource management. ERP software helps companies efficiently acquire, manage, and consume resources. They help project managers by providing accurate and timely data for projects and by tracking finances, spending, and budgets. For support or reporting issues, include Question ID: 64cfbfae080c0d4b71c72ef6 in your ticket. Thank you.
Explanation
CRM (Customer Relationship Management) software help manage customer interactions. They allow companies to create and maintain relationships with customers to improve the company’s profits by increasing customer loyalty. They can help track customer transactions, feedback, and preferences to make the customer experience more personal. They also allow companies to gain data needed to improve marketing and products. EDMS (Electronic Document Management System) software, are also known as RMS (Record Management Systems) software. These types of software help with the creation, tracking, and sharing of information, but also allow companies to create and edit workflows to improve the efficiency of processes. CMS (Content Management System) software helps create content for websites and other media which can be quite complex. A good CMS provides a clear interface event when the background processes are quite complex. This allows companies to produce better content more quickly and users to more easily use the interfaces that are created. ERP (Enterprise Resource Planning) software helps manage operational workloads including accounting, supply chain activities, procurement processes, and resource management. ERP software helps companies efficiently acquire, manage, and consume resources. They help project managers by providing accurate and timely data for projects and by tracking finances, spending, and budgets. For support or reporting issues, include Question ID: 64cfbfae080c0d4b71c72ef6 in your ticket. Thank you.
Question 15 Single Choice
Something has gone wrong in Witches Potions' project. They have spent several weeks trying to determine what has gone wrong and why it went wrong. They have decided to bring in a chemist to look at the project and see if she can determine what has happened and what to do next. What type of project evaluation is this?
Explanation
Click "Show Answer" to see the explanation here
OBJ 2.5: External evaluation is conducted by a third party to provide an objective assessment of a product, service, or project. External evaluations can provide a fresh perspective and identify blind spots or weaknesses that may have been missed internally. The chemist will make recommendations on what to do, so the project is still ongoing. The chemist isn't conducting ongoing evaluation because that would be conducted by the team, not an outside specialist. For support or reporting issues, include Question ID: 64c411abd52c79bdb21b32db in your ticket. Thank you.
Explanation
OBJ 2.5: External evaluation is conducted by a third party to provide an objective assessment of a product, service, or project. External evaluations can provide a fresh perspective and identify blind spots or weaknesses that may have been missed internally. The chemist will make recommendations on what to do, so the project is still ongoing. The chemist isn't conducting ongoing evaluation because that would be conducted by the team, not an outside specialist. For support or reporting issues, include Question ID: 64c411abd52c79bdb21b32db in your ticket. Thank you.
Question 16 Single Choice
Which of the following statements accurately describes the differences between waterfall and agile teams in terms of team size and composition?
Explanation
Click "Show Answer" to see the explanation here
Agile teams are small by design, typically consisting of 3–10 members. This small size facilitates communication and collaboration. On the other hand, waterfall project teams can be any size. For support or reporting issues, include Question ID: 64a5bc41b2dc1eed3f4ca21f in your ticket. Thank you.
Explanation
Agile teams are small by design, typically consisting of 3–10 members. This small size facilitates communication and collaboration. On the other hand, waterfall project teams can be any size. For support or reporting issues, include Question ID: 64a5bc41b2dc1eed3f4ca21f in your ticket. Thank you.
Question 17 Single Choice
Which of the following business case sections includes a brief synopsis of the project and should be written last?
Explanation
Click "Show Answer" to see the explanation here
OBJ 2.1: The executive summary is a synopsis of the business case, which is a few sentences long. It is recommended that you write it last so it provides a good summary of what is contained in the business case. The problem statement contains the issues that you are trying to solve, which can be stated as an unmet opportunity. It should be short and get to the point. The economic impacts section outlines the consequences for the company, such as the cost, investments needed, and what is gained from the project. The project recommendation should explain which of the possible solutions should be pursued. For support or reporting issues, include Question ID: 6491b5e02c6ebd52d45915f3 in your ticket. Thank you.
Explanation
OBJ 2.1: The executive summary is a synopsis of the business case, which is a few sentences long. It is recommended that you write it last so it provides a good summary of what is contained in the business case. The problem statement contains the issues that you are trying to solve, which can be stated as an unmet opportunity. It should be short and get to the point. The economic impacts section outlines the consequences for the company, such as the cost, investments needed, and what is gained from the project. The project recommendation should explain which of the possible solutions should be pursued. For support or reporting issues, include Question ID: 6491b5e02c6ebd52d45915f3 in your ticket. Thank you.
Question 18 Single Choice
What is the purpose of the RAM in project management?
Explanation
Click "Show Answer" to see the explanation here
OBJ 2.2: The Responsibility Assignment Matrix (RAM), also called a RACI chart, is a project management tool that clarifies roles and responsibilities for tasks or activities. It lists the individuals involved in the project and specifies their roles in completing each task. The RAM aids in effective task allocation by designating who is responsible (R), accountable (A), consulted (C), and informed (I) for each task. By using the RAM, project managers can ensure tasks are assigned to the appropriate individuals based on their skills and availability, and they can also more effectively monitor and manage task progress. For support or reporting issues, include Question ID: 64a5bd6deac92738a43c6909 in your ticket. Thank you.
Explanation
OBJ 2.2: The Responsibility Assignment Matrix (RAM), also called a RACI chart, is a project management tool that clarifies roles and responsibilities for tasks or activities. It lists the individuals involved in the project and specifies their roles in completing each task. The RAM aids in effective task allocation by designating who is responsible (R), accountable (A), consulted (C), and informed (I) for each task. By using the RAM, project managers can ensure tasks are assigned to the appropriate individuals based on their skills and availability, and they can also more effectively monitor and manage task progress. For support or reporting issues, include Question ID: 64a5bd6deac92738a43c6909 in your ticket. Thank you.
Question 19 Single Choice
What is the purpose of the project closure meeting?
Explanation
Click "Show Answer" to see the explanation here
OBJ 2.5: The purpose of the project closure meeting is to obtain verbal approval to close the project by the end of the meeting and gather feedback. The meeting also focuses on discussing the project's accomplishments, failures, and challenges and serves as the last working session before closing the project. For support or reporting issues, include Question ID: 64a6f556554e231fb44c5f0c in your ticket. Thank you.
Explanation
OBJ 2.5: The purpose of the project closure meeting is to obtain verbal approval to close the project by the end of the meeting and gather feedback. The meeting also focuses on discussing the project's accomplishments, failures, and challenges and serves as the last working session before closing the project. For support or reporting issues, include Question ID: 64a6f556554e231fb44c5f0c in your ticket. Thank you.
Question 20 Single Choice
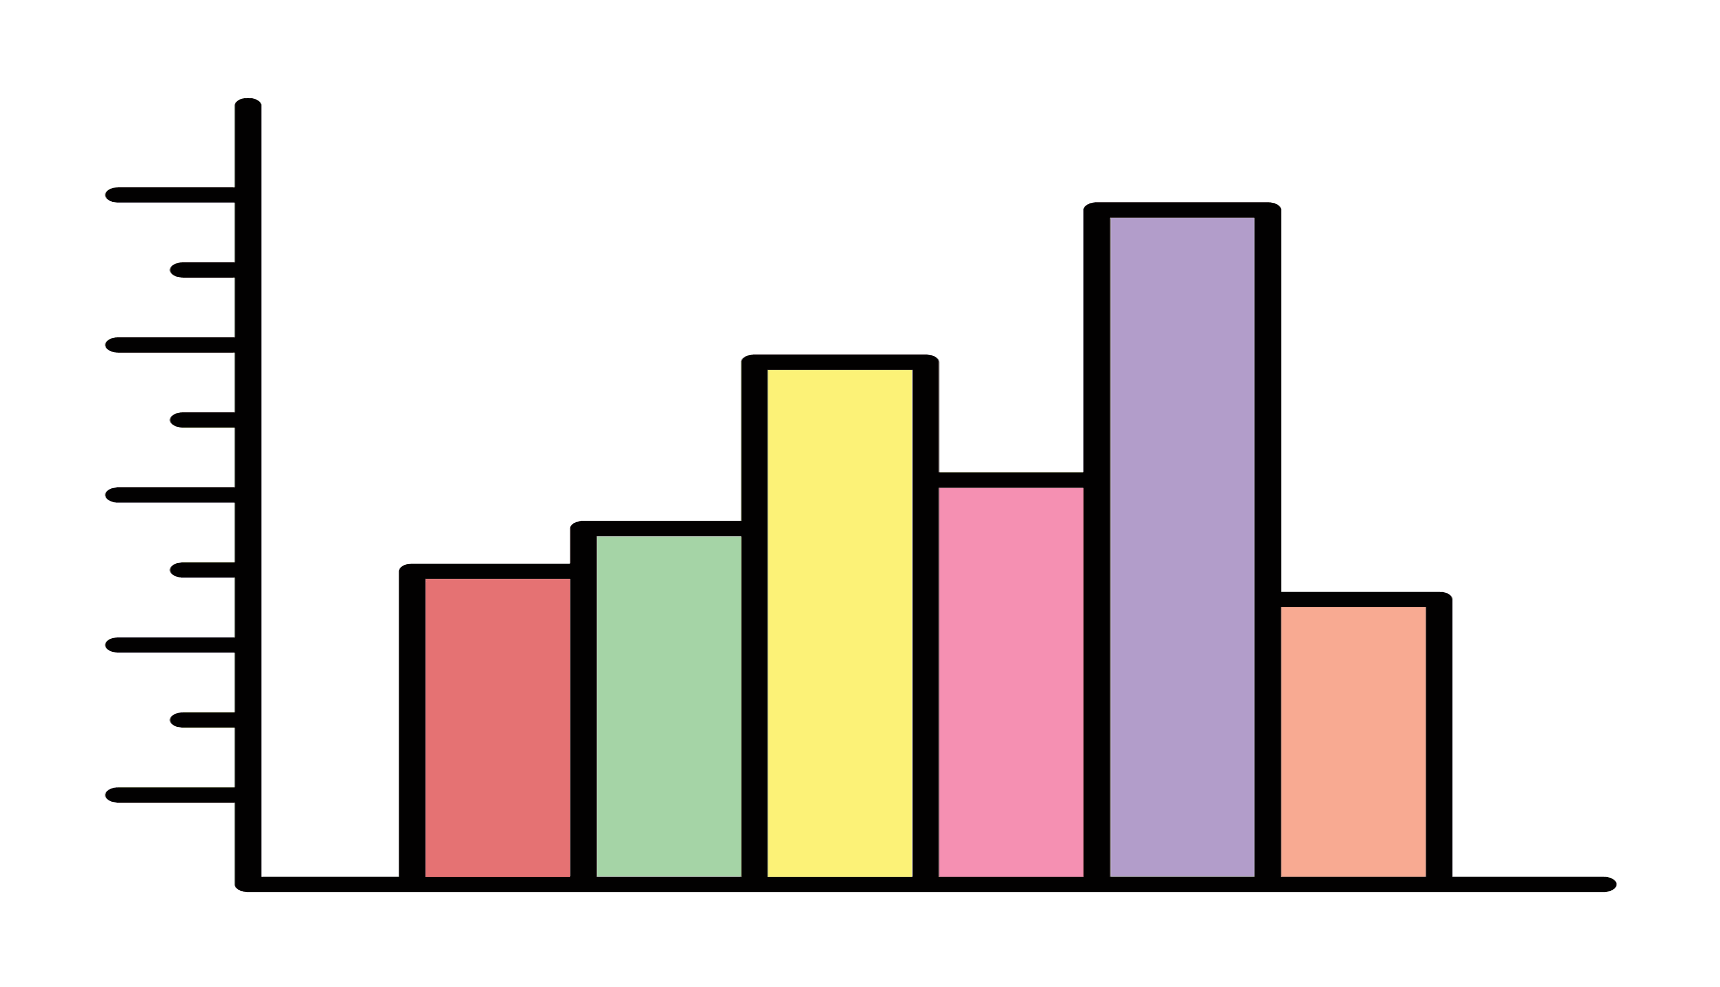
Which visual is shown below?
Explanation
Click "Show Answer" to see the explanation here
OBJ 3.3: Histograms are a type of column chart frequently used in statistical analysis. The horizontal axis displays a series of continuous data points, while the vertical axis shows the frequency at which each value on the horizontal axis occurs. The columns in the chart are sized based on the frequency of each value, with more frequent values represented by taller columns. Burndown charts track two key values: target work and actual work, and can be represented as line charts or line and column charts, with either format working effectively. A line that represents the target shows the work remaining in the time period. The goal is to have the line at the bottom when all the work is completed. It focuses on the end goal and is particularly useful for projects that have fixed timelines and flexible scopes. Burnup charts show the amount of work completed in the time period, with a line indicating the target for completed work. At the start of the project, the line begins at zero and ends at the total amount of work needed for completion. The progress is measured toward the total, moving up as work is completed. Burnup charts work well for projects with a fixed scope and a flexible timeline. Velocity charts measure the number of story points completed per iteration, but they are not designed to manage a flexible timeline with a fixed scope. Velocity charts are mainly used by teams that measure work with story points. Throughput charts track the number of work items completed per iteration and are not intended for managing a flexible timeline with a fixed scope. They are useful for any team that tracks work items, regardless of the project's timeline and scope. For support or reporting issues, include Question ID: 64cbfe43218da6f22bc0b75f in your ticket. Thank you.
Explanation
OBJ 3.3: Histograms are a type of column chart frequently used in statistical analysis. The horizontal axis displays a series of continuous data points, while the vertical axis shows the frequency at which each value on the horizontal axis occurs. The columns in the chart are sized based on the frequency of each value, with more frequent values represented by taller columns. Burndown charts track two key values: target work and actual work, and can be represented as line charts or line and column charts, with either format working effectively. A line that represents the target shows the work remaining in the time period. The goal is to have the line at the bottom when all the work is completed. It focuses on the end goal and is particularly useful for projects that have fixed timelines and flexible scopes. Burnup charts show the amount of work completed in the time period, with a line indicating the target for completed work. At the start of the project, the line begins at zero and ends at the total amount of work needed for completion. The progress is measured toward the total, moving up as work is completed. Burnup charts work well for projects with a fixed scope and a flexible timeline. Velocity charts measure the number of story points completed per iteration, but they are not designed to manage a flexible timeline with a fixed scope. Velocity charts are mainly used by teams that measure work with story points. Throughput charts track the number of work items completed per iteration and are not intended for managing a flexible timeline with a fixed scope. They are useful for any team that tracks work items, regardless of the project's timeline and scope. For support or reporting issues, include Question ID: 64cbfe43218da6f22bc0b75f in your ticket. Thank you.
Page: 2 / 54