
Microsoft Certified: Power BI Data Analyst Associate - (PL-300) Exam Questions
Total Questions
Last Updated
1st Try Guaranteed

Experts Verified
Question 1 Single Choice
True or False: Quick Measures in Power BI can be used to create complex DAX calculations for common scenarios like "Running Total" without writing any DAX code.
Explanation

Click "Show Answer" to see the explanation here
What are Quick Measures?
Quick Measures are a feature in Power BI that simplify the process of creating DAX measures. They provide a user-friendly interface where you can select from a library of pre-built calculations, such as:
Running Total: Calculates the cumulative sum of a value over time or across categories.
Year-over-Year Growth: Calculates the percentage change in a value compared to the same period in the previous year.
Month-over-Month Change: Calculates the difference in a value between consecutive months.
Averages, Percentiles, and more: Provides various other common calculations like averages, medians, percentiles, and ranking.
How Quick Measures Work:
Selection: You select the desired calculation from the Quick Measures library.
Configuration: You specify the relevant fields for the calculation, such as the value to be aggregated, the field to use for grouping or sorting, and any filters or conditions.
Automatic DAX Generation: Power BI automatically generates the DAX formula required to perform the selected calculation based on your configuration.
Measure Creation: The measure is created and added to your data model, ready to be used in your reports and visualizations.
Benefits of Quick Measures:
Simplified DAX: They make DAX more accessible to users who are not familiar with the language or syntax.
Faster Development: They speed up report development by eliminating the need to manually write DAX formulas for common calculations.
Reduced Errors: They reduce the risk of errors in DAX formulas, as the code is generated automatically by Power BI.
Learning Tool: They can be used as a learning tool to understand how DAX formulas are constructed for different calculations.
Example: Creating a Running Total with Quick Measures:
Let's say you want to calculate the running total of sales over time. Instead of writing a DAX formula with functions like CALCULATE and FILTER, you can use the "Running Total" Quick Measure. You would simply select the "Sales Amount" field as the value to aggregate and the "Order Date" field as the field to use for ordering. Power BI will then generate the appropriate DAX formula for you.
In essence: Quick Measures provide a powerful yet user-friendly way to create complex DAX calculations without requiring in-depth knowledge of DAX syntax. They simplify data analysis, accelerate report development, and make advanced analytics more accessible to a wider range of users.
Explanation
What are Quick Measures?
Quick Measures are a feature in Power BI that simplify the process of creating DAX measures. They provide a user-friendly interface where you can select from a library of pre-built calculations, such as:
Running Total: Calculates the cumulative sum of a value over time or across categories.
Year-over-Year Growth: Calculates the percentage change in a value compared to the same period in the previous year.
Month-over-Month Change: Calculates the difference in a value between consecutive months.
Averages, Percentiles, and more: Provides various other common calculations like averages, medians, percentiles, and ranking.
How Quick Measures Work:
Selection: You select the desired calculation from the Quick Measures library.
Configuration: You specify the relevant fields for the calculation, such as the value to be aggregated, the field to use for grouping or sorting, and any filters or conditions.
Automatic DAX Generation: Power BI automatically generates the DAX formula required to perform the selected calculation based on your configuration.
Measure Creation: The measure is created and added to your data model, ready to be used in your reports and visualizations.
Benefits of Quick Measures:
Simplified DAX: They make DAX more accessible to users who are not familiar with the language or syntax.
Faster Development: They speed up report development by eliminating the need to manually write DAX formulas for common calculations.
Reduced Errors: They reduce the risk of errors in DAX formulas, as the code is generated automatically by Power BI.
Learning Tool: They can be used as a learning tool to understand how DAX formulas are constructed for different calculations.
Example: Creating a Running Total with Quick Measures:
Let's say you want to calculate the running total of sales over time. Instead of writing a DAX formula with functions like CALCULATE and FILTER, you can use the "Running Total" Quick Measure. You would simply select the "Sales Amount" field as the value to aggregate and the "Order Date" field as the field to use for ordering. Power BI will then generate the appropriate DAX formula for you.
In essence: Quick Measures provide a powerful yet user-friendly way to create complex DAX calculations without requiring in-depth knowledge of DAX syntax. They simplify data analysis, accelerate report development, and make advanced analytics more accessible to a wider range of users.
Question 2 Single Choice
To share a Power BI report with a colleague without granting them editing rights, you should _______.
Explanation
Click "Show Answer" to see the explanation here
D. provide them with view-only access to the report:
Controlled Access: This option allows you to share the report with specific individuals or groups while explicitly restricting their ability to make any changes. They can view and interact with the report, such as filtering data or drilling down into details, but they cannot modify the report design, add or remove visuals, or change the underlying data.
Security: View-only access ensures that the report's integrity is maintained and prevents accidental or unauthorized modifications. This is particularly important for reports that contain sensitive data or are used for critical decision-making.
Collaboration: While preventing editing, view-only access still enables collaboration. Colleagues can provide feedback, share insights, and discuss the report's findings without the risk of altering the report itself.
Why other options are not suitable:
A. publish the report to the web: Publishing to the web makes the report publicly accessible to anyone on the internet. This is not appropriate for sharing a report with specific colleagues, especially if it contains confidential or proprietary information.
B. share a dashboard instead of a report: While dashboards provide a summarized view of data, they don't necessarily restrict editing rights to the underlying reports. If your colleague has edit permissions to the workspace or the report itself, they could still modify the report even if you only share the dashboard.
C. create a dedicated app workspace: App workspaces are designed for collaboration and content organization. While you can control permissions within an app workspace, it's not the most direct or efficient way to simply share a report with view-only access.
In summary: Providing view-only access to the report is the most appropriate solution because it directly addresses the requirement of sharing without granting editing rights. It ensures controlled access, maintains report integrity, and enables collaboration while preventing any unauthorized modifications.
Explanation
D. provide them with view-only access to the report:
Controlled Access: This option allows you to share the report with specific individuals or groups while explicitly restricting their ability to make any changes. They can view and interact with the report, such as filtering data or drilling down into details, but they cannot modify the report design, add or remove visuals, or change the underlying data.
Security: View-only access ensures that the report's integrity is maintained and prevents accidental or unauthorized modifications. This is particularly important for reports that contain sensitive data or are used for critical decision-making.
Collaboration: While preventing editing, view-only access still enables collaboration. Colleagues can provide feedback, share insights, and discuss the report's findings without the risk of altering the report itself.
Why other options are not suitable:
A. publish the report to the web: Publishing to the web makes the report publicly accessible to anyone on the internet. This is not appropriate for sharing a report with specific colleagues, especially if it contains confidential or proprietary information.
B. share a dashboard instead of a report: While dashboards provide a summarized view of data, they don't necessarily restrict editing rights to the underlying reports. If your colleague has edit permissions to the workspace or the report itself, they could still modify the report even if you only share the dashboard.
C. create a dedicated app workspace: App workspaces are designed for collaboration and content organization. While you can control permissions within an app workspace, it's not the most direct or efficient way to simply share a report with view-only access.
In summary: Providing view-only access to the report is the most appropriate solution because it directly addresses the requirement of sharing without granting editing rights. It ensures controlled access, maintains report integrity, and enables collaboration while preventing any unauthorized modifications.
Question 3 Single Choice
Scenario:
Imagine you're a data analyst working for a library. You have two CSV files: "Books" and "Authors."
The "Books" file contains information about each book, including its title, ISBN, author ID, and genre.
The "Authors" file contains details about each author, including their author ID, name, and nationality.
You want to create a Power BI report that analyzes book data, including author information.
Challenge: You need to combine the data from these two CSV files into a single Power BI dataset with a table named "BookDetails." This table should include the following columns:
Title
ISBN
Author ID
Genre
Author Name
Author Nationality
Solution: How should you combine the "Books" and "Authors" queries in Power Query Editor, and how should you manage the loading of the "Authors" query to achieve this?
Explanation
Click "Show Answer" to see the explanation here
C. Combine the queries by performing a: Merge; On the Authors query: Disable the query load (Correct):
This option correctly identifies the appropriate actions for combining the data and managing query loading.
Merge Queries: Merging queries in Power Query is like performing a join operation in SQL. It allows you to combine data from two tables based on a common column, in this case, the "Author ID." This creates a new table where each row represents a book and includes its information from the "Books" query along with the corresponding author information from the "Authors" query.
Disable Query Load: Disabling the load for the "Authors" query prevents it from being loaded as a separate table in your Power BI data model. This is important because you only want a single table ("BookDetails") in your dataset, not separate "Books" and "Authors" tables. Disabling the load ensures that the "Authors" query is only used as an intermediate step for merging data into the "BookDetails" table.
Why other options are incorrect:
A. Combine the queries by performing a: Append; On the Authors query: Delete the query: Appending queries stacks them vertically, adding the rows from one table to the end of the other. This wouldn't create the desired output with book and author information combined in the same row. Deleting the "Authors" query would prevent the merge operation from working, as the "BookDetails" query would no longer have access to the author information.
B. Combine the queries by performing a: Append; On the Authors query: Disable the query load: As explained above, appending is not the correct operation for combining data based on a common column.
D. Combine the queries by performing a: Append; On the Authors query: Exclude the query from report refresh: While excluding the "Authors" query from refresh might seem like a way to prevent it from being loaded as a separate table, it's not the recommended approach. Disabling the query load is a more direct and explicit way to achieve this.
Key Takeaway: This question emphasizes the importance of understanding data combination techniques and query loading options in Power Query. By merging queries based on a common column and disabling the load for the secondary query, you can efficiently combine data from multiple sources into a single table, optimizing your Power BI data model and simplifying report development.
Explanation
C. Combine the queries by performing a: Merge; On the Authors query: Disable the query load (Correct):
This option correctly identifies the appropriate actions for combining the data and managing query loading.
Merge Queries: Merging queries in Power Query is like performing a join operation in SQL. It allows you to combine data from two tables based on a common column, in this case, the "Author ID." This creates a new table where each row represents a book and includes its information from the "Books" query along with the corresponding author information from the "Authors" query.
Disable Query Load: Disabling the load for the "Authors" query prevents it from being loaded as a separate table in your Power BI data model. This is important because you only want a single table ("BookDetails") in your dataset, not separate "Books" and "Authors" tables. Disabling the load ensures that the "Authors" query is only used as an intermediate step for merging data into the "BookDetails" table.
Why other options are incorrect:
A. Combine the queries by performing a: Append; On the Authors query: Delete the query: Appending queries stacks them vertically, adding the rows from one table to the end of the other. This wouldn't create the desired output with book and author information combined in the same row. Deleting the "Authors" query would prevent the merge operation from working, as the "BookDetails" query would no longer have access to the author information.
B. Combine the queries by performing a: Append; On the Authors query: Disable the query load: As explained above, appending is not the correct operation for combining data based on a common column.
D. Combine the queries by performing a: Append; On the Authors query: Exclude the query from report refresh: While excluding the "Authors" query from refresh might seem like a way to prevent it from being loaded as a separate table, it's not the recommended approach. Disabling the query load is a more direct and explicit way to achieve this.
Key Takeaway: This question emphasizes the importance of understanding data combination techniques and query loading options in Power Query. By merging queries based on a common column and disabling the load for the secondary query, you can efficiently combine data from multiple sources into a single table, optimizing your Power BI data model and simplifying report development.
Question 4 Multiple Choice
In the development of a Power BI report, you aim to analyze the distribution of integer values by grouping them into defined intervals.
To effectively create a histogram that displays these data distributions across several ranges, which two components must you incorporate?
Explanation
Click "Show Answer" to see the explanation here
A. A linear scale setting (originally a continuous axis setting)
This option, while somewhat aligned with the concept of a continuous axis, refers more broadly to the way the axis is scaled. In histograms, while the axis should indeed be continuous (or linear) for the variable being binned, this option by itself doesn't necessarily imply the axis setting that is specific to constructing histograms, such as defining the bin ranges or the interval type. Therefore, while related, it doesn’t specify the creation of bins, which are crucial for a histogram.B. A textual data field (originally a categorical column)
Textual data fields or categorical columns are typically used in charts where data categorization is based on non-numerical values such as names, types, or categories. In the context of histograms, which require numerical data to create bins of continuous data ranges, textual data fields are irrelevant. Histograms need numeric intervals, not categories based on text.C. A calculated measure (originally a Measure aggregation)
While measures are fundamental in aggregating data in many report types within Power BI, a calculated measure itself does not facilitate the creation of a histogram. Histograms primarily require data to be divided into bins rather than aggregated by sums, averages, counts, etc. Measures might be used alongside histograms for additional analysis or overlay, but they are not essential for the construction of the histogram itself.D. A quantitative data field (originally a Numerical column)
Essential to histogram construction, this option involves using numerical data that can be segmented into ranges or bins. Quantitative or numerical data fields provide the necessary values that can be grouped into the bins representing different intervals of the data set, which is central to visualizing distributions in histogram form.E. A classification of bins (originally a Bin group type)
This choice directly pertains to how data is organized within a histogram. Classifying data into bins is what allows a histogram to display the frequency of data points within range intervals. This bin classification system is pivotal because it defines the boundaries of data segments, making it possible to observe the distribution patterns across the dataset.
Explanation
A. A linear scale setting (originally a continuous axis setting)
This option, while somewhat aligned with the concept of a continuous axis, refers more broadly to the way the axis is scaled. In histograms, while the axis should indeed be continuous (or linear) for the variable being binned, this option by itself doesn't necessarily imply the axis setting that is specific to constructing histograms, such as defining the bin ranges or the interval type. Therefore, while related, it doesn’t specify the creation of bins, which are crucial for a histogram.B. A textual data field (originally a categorical column)
Textual data fields or categorical columns are typically used in charts where data categorization is based on non-numerical values such as names, types, or categories. In the context of histograms, which require numerical data to create bins of continuous data ranges, textual data fields are irrelevant. Histograms need numeric intervals, not categories based on text.C. A calculated measure (originally a Measure aggregation)
While measures are fundamental in aggregating data in many report types within Power BI, a calculated measure itself does not facilitate the creation of a histogram. Histograms primarily require data to be divided into bins rather than aggregated by sums, averages, counts, etc. Measures might be used alongside histograms for additional analysis or overlay, but they are not essential for the construction of the histogram itself.D. A quantitative data field (originally a Numerical column)
Essential to histogram construction, this option involves using numerical data that can be segmented into ranges or bins. Quantitative or numerical data fields provide the necessary values that can be grouped into the bins representing different intervals of the data set, which is central to visualizing distributions in histogram form.E. A classification of bins (originally a Bin group type)
This choice directly pertains to how data is organized within a histogram. Classifying data into bins is what allows a histogram to display the frequency of data points within range intervals. This bin classification system is pivotal because it defines the boundaries of data segments, making it possible to observe the distribution patterns across the dataset.
Question 5 Multiple Choice
When configuring Row-Level Security (RLS) in Power BI, which of the following statements are true? (Select two)
Explanation
Click "Show Answer" to see the explanation here
A) RLS can only be configured in the Power BI service, not in Power BI Desktop.
Incorrect. RLS is primarily configured in Power BI Desktop, where you define roles and DAX expressions that control access to data at the row level. After setting up RLS, you publish the Power BI Desktop file to the Power BI service to enforce these security settings. This statement is incorrect because the initial configuration of RLS indeed happens in Power BI Desktop.
B) Once published to Power BI service, RLS rules cannot be tested using "Test as role" feature in Power BI Desktop.
Incorrect. The "Test as role" feature in Power BI Desktop allows you to simulate the experience of a user assigned to a specific RLS role, even before publishing to the Power BI service. This functionality is crucial for validating that RLS rules work as intended. Therefore, this statement is incorrect because you can test RLS roles in Power BI Desktop.
C) RLS settings are automatically applied to all reports and dashboards that use the secured dataset within the Power BI service.
Correct. When you configure RLS on a dataset and publish it to the Power BI service, any reports or dashboards built on that dataset automatically inherit the RLS settings. This ensures that the data security rules are consistently applied, regardless of the report or dashboard using the secured dataset.
D) RLS requires a Power BI Pro license for users to configure roles and rules within Power BI Desktop.
Incorrect. Configuring RLS within Power BI Desktop does not require a Power BI Pro license. The license requirement comes into play when sharing reports and dashboards based on RLS-secured datasets in the Power BI service. To access or interact with shared content in the service, users generally need a Power BI Pro license, or the content needs to be hosted in a Power BI Premium capacity.
E) User roles and permissions for RLS can be assigned and managed in the Power BI service after publishing the dataset.
Correct. After you have configured RLS in Power BI Desktop and published the dataset to the Power BI service, you can manage user access to roles through the service. This includes adding or removing users and security groups to the roles defined in Power BI Desktop, facilitating dynamic access management without needing to modify the dataset directly.
Explanation
A) RLS can only be configured in the Power BI service, not in Power BI Desktop.
Incorrect. RLS is primarily configured in Power BI Desktop, where you define roles and DAX expressions that control access to data at the row level. After setting up RLS, you publish the Power BI Desktop file to the Power BI service to enforce these security settings. This statement is incorrect because the initial configuration of RLS indeed happens in Power BI Desktop.
B) Once published to Power BI service, RLS rules cannot be tested using "Test as role" feature in Power BI Desktop.
Incorrect. The "Test as role" feature in Power BI Desktop allows you to simulate the experience of a user assigned to a specific RLS role, even before publishing to the Power BI service. This functionality is crucial for validating that RLS rules work as intended. Therefore, this statement is incorrect because you can test RLS roles in Power BI Desktop.
C) RLS settings are automatically applied to all reports and dashboards that use the secured dataset within the Power BI service.
Correct. When you configure RLS on a dataset and publish it to the Power BI service, any reports or dashboards built on that dataset automatically inherit the RLS settings. This ensures that the data security rules are consistently applied, regardless of the report or dashboard using the secured dataset.
D) RLS requires a Power BI Pro license for users to configure roles and rules within Power BI Desktop.
Incorrect. Configuring RLS within Power BI Desktop does not require a Power BI Pro license. The license requirement comes into play when sharing reports and dashboards based on RLS-secured datasets in the Power BI service. To access or interact with shared content in the service, users generally need a Power BI Pro license, or the content needs to be hosted in a Power BI Premium capacity.
E) User roles and permissions for RLS can be assigned and managed in the Power BI service after publishing the dataset.
Correct. After you have configured RLS in Power BI Desktop and published the dataset to the Power BI service, you can manage user access to roles through the service. This includes adding or removing users and security groups to the roles defined in Power BI Desktop, facilitating dynamic access management without needing to modify the dataset directly.
Question 6 Single Choice
Scenario: Imagine you're a BI developer building a sales performance dashboard for a large retail company. You're creating a Power BI data model as in the following picture:
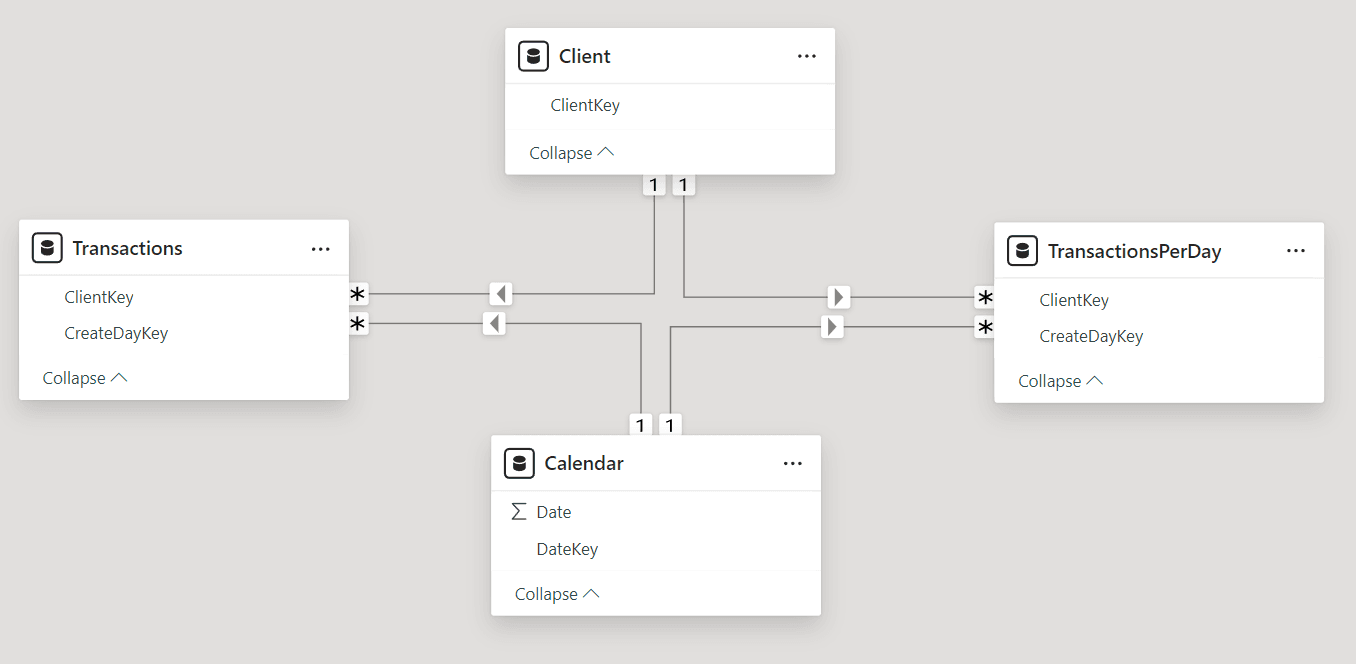
Challenge: You need to choose the most suitable storage mode for each table in your data model, considering the following requirements:
Refresh Frequency: Each table has different refresh requirements, ranging from infrequent updates (Client) to near real-time updates (Transactions).
Visual Performance: You want to minimize the load times of visuals in your reports and dashboards, ensuring a responsive and interactive user experience.
Solution: Which storage mode should you select for each table to meet these requirements?
Explanation
Click "Show Answer" to see the explanation here
Calendar: Dual (Correct):
Dual storage mode in Power BI combines the benefits of both Import and DirectQuery modes. It allows you to import a subset of the data for faster visual load times while also enabling DirectQuery for real-time updates on specific fields or calculations.
Infrequent Updates: Since the Calendar table data is relatively static, importing it provides the best performance for visuals.
Flexibility: Dual mode allows you to switch to DirectQuery for specific queries or calculations if needed, providing flexibility for handling infrequent updates or accessing the latest data.
Client: Dual (Correct):
Similar to the Calendar table, the Client table has occasional updates. Dual mode provides a balance between performance and data freshness.
Performance: Importing the product data ensures fast visual load times.
Occasional Updates: Dual mode allows you to use DirectQuery for specific queries or calculations to access the latest client information when needed.
Transactions: DirectQuery (Correct):
The Transactions table requires near real-time updates, making DirectQuery the most suitable storage mode.
Real-time Data: DirectQuery queries the data source directly, ensuring that the report always reflects the latest sales transactions.
No Data Duplication: DirectQuery avoids the need to import and store the Transactions data in Power BI, reducing storage requirements and refresh times.
TransactionsPerDay: Import (Correct):
The TransactionsPerDay table contains pre-calculated daily summaries. Importing this data provides the best performance for visuals and aligns with the daily refresh requirement.
Optimized for Visuals: Import mode ensures that the aggregated data is readily available for fast visual rendering.
Daily Refresh: The daily refresh schedule can be easily configured for imported datasets.
Key Takeaway: This question emphasizes the importance of choosing the right storage mode for each table in a Power BI data model based on refresh requirements and performance considerations. By carefully selecting the appropriate mode (Import, DirectQuery, or Dual), you can optimize visual load times, ensure data freshness, and create a responsive and efficient reporting solution.
Explanation
Calendar: Dual (Correct):
Dual storage mode in Power BI combines the benefits of both Import and DirectQuery modes. It allows you to import a subset of the data for faster visual load times while also enabling DirectQuery for real-time updates on specific fields or calculations.
Infrequent Updates: Since the Calendar table data is relatively static, importing it provides the best performance for visuals.
Flexibility: Dual mode allows you to switch to DirectQuery for specific queries or calculations if needed, providing flexibility for handling infrequent updates or accessing the latest data.
Client: Dual (Correct):
Similar to the Calendar table, the Client table has occasional updates. Dual mode provides a balance between performance and data freshness.
Performance: Importing the product data ensures fast visual load times.
Occasional Updates: Dual mode allows you to use DirectQuery for specific queries or calculations to access the latest client information when needed.
Transactions: DirectQuery (Correct):
The Transactions table requires near real-time updates, making DirectQuery the most suitable storage mode.
Real-time Data: DirectQuery queries the data source directly, ensuring that the report always reflects the latest sales transactions.
No Data Duplication: DirectQuery avoids the need to import and store the Transactions data in Power BI, reducing storage requirements and refresh times.
TransactionsPerDay: Import (Correct):
The TransactionsPerDay table contains pre-calculated daily summaries. Importing this data provides the best performance for visuals and aligns with the daily refresh requirement.
Optimized for Visuals: Import mode ensures that the aggregated data is readily available for fast visual rendering.
Daily Refresh: The daily refresh schedule can be easily configured for imported datasets.
Key Takeaway: This question emphasizes the importance of choosing the right storage mode for each table in a Power BI data model based on refresh requirements and performance considerations. By carefully selecting the appropriate mode (Import, DirectQuery, or Dual), you can optimize visual load times, ensure data freshness, and create a responsive and efficient reporting solution.
Question 7 Single Choice
Arrange the following steps in the correct order to use the "Group By" feature in Power Query for creating a summary table that shows the total sales amount per year from a table named "Sales" with columns "SaleDate" and "SaleAmount".
Choose "Sum" as the operation and select the "SaleAmount" column.
Open the "Group By" dialog from the Home tab.
Select "Year" as the column to group by.
Add a custom column to extract the year from "SaleDate".
Explanation
Click "Show Answer" to see the explanation here
1. Add a custom column to extract the year from "SaleDate" (Step 4)
Before you can group your sales data by year, you need each sale to be associated with a year. The "SaleDate" column contains dates from which the year needs to be extracted. This is done by adding a custom column in Power Query:
In Power Query, you would use the "Add Column" tab and then select "Custom Column".
In the custom column formula, you would use a date function to extract the year from each "SaleDate". The formula might look something like
Date.Year([SaleDate]).This action adds a new column (which you might name "Year") to your table, containing the year extracted from each "SaleDate".
2. Open the "Group By" dialog from the Home tab (Step 2)
With the "Year" column now available, you're ready to group your data:
On the Home tab in Power Query, there's an option to "Group By". Selecting this option opens a dialog box where you can specify how you want to group your data.
3. Select "Year" as the column to group by (Step 3)
In the "Group By" dialog:
You would choose the new "Year" column as the basis for grouping your data. This tells Power Query that you want to consolidate your data based on the year each sale was made.
4. Choose "Sum" as the operation and select the "SaleAmount" column (Step 1)
Finally, to get the total sales amount per year:
Still in the "Group By" dialog, you would specify that you want to perform a "Sum" operation on the "SaleAmount" column. This calculates the total sales for each year, based on the grouping you've defined.
After configuring these settings, clicking OK will apply the grouping and summing operation, resulting in a summary table with each unique year from your sales data and the corresponding total sales amount for that year.
Explanation
1. Add a custom column to extract the year from "SaleDate" (Step 4)
Before you can group your sales data by year, you need each sale to be associated with a year. The "SaleDate" column contains dates from which the year needs to be extracted. This is done by adding a custom column in Power Query:
In Power Query, you would use the "Add Column" tab and then select "Custom Column".
In the custom column formula, you would use a date function to extract the year from each "SaleDate". The formula might look something like
Date.Year([SaleDate]).This action adds a new column (which you might name "Year") to your table, containing the year extracted from each "SaleDate".
2. Open the "Group By" dialog from the Home tab (Step 2)
With the "Year" column now available, you're ready to group your data:
On the Home tab in Power Query, there's an option to "Group By". Selecting this option opens a dialog box where you can specify how you want to group your data.
3. Select "Year" as the column to group by (Step 3)
In the "Group By" dialog:
You would choose the new "Year" column as the basis for grouping your data. This tells Power Query that you want to consolidate your data based on the year each sale was made.
4. Choose "Sum" as the operation and select the "SaleAmount" column (Step 1)
Finally, to get the total sales amount per year:
Still in the "Group By" dialog, you would specify that you want to perform a "Sum" operation on the "SaleAmount" column. This calculates the total sales for each year, based on the grouping you've defined.
After configuring these settings, clicking OK will apply the grouping and summing operation, resulting in a summary table with each unique year from your sales data and the corresponding total sales amount for that year.
Question 8 Multiple Choice
A financial institution wants to leverage its historical transaction data to identify fraudulent transactions and improve customer service.
The data is stored across multiple legacy systems and needs to be consolidated, cleaned, and analyzed.
Identify the roles that would be involved in each stage of this process and explain their contributions.
Explanation
Click "Show Answer" to see the explanation here
A) Data Engineer: Correct because they build the pipelines and architecture needed to consolidate data from various sources into a single, clean dataset.
B) Data Analyst: Correct as they would analyze the cleaned data to identify any immediate trends or insights that could be acted upon.
C) Data Scientist: Correct because they would use advanced analytics and machine learning models to predict fraudulent transactions based on historical data.
D) Database Administrator: Correct as they play a crucial role in ensuring the database systems are optimized, secure, and performant throughout the consolidation and analysis process.
Explanation
A) Data Engineer: Correct because they build the pipelines and architecture needed to consolidate data from various sources into a single, clean dataset.
B) Data Analyst: Correct as they would analyze the cleaned data to identify any immediate trends or insights that could be acted upon.
C) Data Scientist: Correct because they would use advanced analytics and machine learning models to predict fraudulent transactions based on historical data.
D) Database Administrator: Correct as they play a crucial role in ensuring the database systems are optimized, secure, and performant throughout the consolidation and analysis process.
Question 9 Single Choice
True or False: It's possible to apply Row-Level Security (RLS) directly to Power BI dashboards to control user access to specific data within the dashboard.
Explanation
Click "Show Answer" to see the explanation here
Row-Level Security (RLS) in Power BI is applied at the dataset level, not directly to dashboards or reports. RLS controls access to data by restricting data row visibility based on the user's role. When a user interacts with a report or dashboard in Power BI, the data presented to them is automatically filtered based on the RLS rules defined in the dataset the report or dashboard is built upon. This ensures that users only see the data they are supposed to see, according to their assigned roles.
Here's a breakdown of how RLS works in Power BI:
Definition of RLS Policies: RLS policies are defined within Power BI Desktop by creating roles and writing DAX expressions to specify the data filtering conditions for each role. These roles dictate which rows of data are visible to users assigned to those roles.
Application of RLS: Once the dataset with RLS is published to the Power BI service, the RLS rules are enforced whenever that dataset is accessed, whether through reports or dashboards. Therefore, the application of RLS is inherently linked to the dataset, and its effects cascade down to all reports and dashboards derived from that dataset.
User Assignment: In the Power BI service, users or groups are assigned to the roles defined in Power BI Desktop. This assignment dictates the data they can access when they view reports and dashboards.
Explanation
Row-Level Security (RLS) in Power BI is applied at the dataset level, not directly to dashboards or reports. RLS controls access to data by restricting data row visibility based on the user's role. When a user interacts with a report or dashboard in Power BI, the data presented to them is automatically filtered based on the RLS rules defined in the dataset the report or dashboard is built upon. This ensures that users only see the data they are supposed to see, according to their assigned roles.
Here's a breakdown of how RLS works in Power BI:
Definition of RLS Policies: RLS policies are defined within Power BI Desktop by creating roles and writing DAX expressions to specify the data filtering conditions for each role. These roles dictate which rows of data are visible to users assigned to those roles.
Application of RLS: Once the dataset with RLS is published to the Power BI service, the RLS rules are enforced whenever that dataset is accessed, whether through reports or dashboards. Therefore, the application of RLS is inherently linked to the dataset, and its effects cascade down to all reports and dashboards derived from that dataset.
User Assignment: In the Power BI service, users or groups are assigned to the roles defined in Power BI Desktop. This assignment dictates the data they can access when they view reports and dashboards.
Question 10 Single Choice
Scenario:
Imagine you're a business analyst working for a manufacturing company.
You're tasked with creating a Power BI report to analyze data from a custom production tracking application that your team built using Microsoft Power Apps.
This application is fully integrated within Microsoft Teams, where your production team uses it to record production data, track orders, and manage inventory.
Question: To build your Power BI report and access the data from this Power Apps production tracking application, which connector should you use in Power BI Desktop?
Explanation
Click "Show Answer" to see the explanation here
C. Dataverse (Correct):
Dataverse is a cloud-based data storage and management platform that serves as the backend for many Microsoft Power Platform applications, including Power Apps. When you build a Power Apps application, especially one that's integrated with Teams, the data is often stored in Dataverse.
Connector Availability: Power BI has a dedicated Dataverse connector that allows you to seamlessly connect to and retrieve data from Dataverse tables and entities.
Data Model: Dataverse uses a structured data model with tables, columns, and relationships, similar to a database. This makes it easy to integrate with Power BI, as you can select the relevant tables and fields for your report.
Security and Access Control: Dataverse provides security features and access control mechanisms that ensure only authorized users and applications can access the data. The Power BI Dataverse connector respects these security settings, allowing you to build secure and compliant reports.
Why other options are incorrect:
A. Microsoft Teams: While the application is hosted in Teams, Teams itself is not the data source. The data is stored in Dataverse, which is a separate service.
B. Excel workbook: Excel workbooks can be used as data sources in Power BI, but they are not the primary storage for Power Apps applications, especially those integrated with Teams.
D. Azure SQL Database: While you could potentially store Power Apps data in an Azure SQL database, it's not the default or recommended approach for Teams-integrated applications. Dataverse is the more common and integrated data storage option for such apps.
Key Takeaway: This question highlights the connection between Power Apps, Dataverse, and Power BI. When creating Power BI reports that need to access data from Power Apps applications, especially those hosted in Microsoft Teams, the Dataverse connector is the most appropriate choice. It provides seamless integration with Dataverse, allowing you to easily access, analyze, and visualize the data from your Power Apps applications in Power BI.
Explanation
C. Dataverse (Correct):
Dataverse is a cloud-based data storage and management platform that serves as the backend for many Microsoft Power Platform applications, including Power Apps. When you build a Power Apps application, especially one that's integrated with Teams, the data is often stored in Dataverse.
Connector Availability: Power BI has a dedicated Dataverse connector that allows you to seamlessly connect to and retrieve data from Dataverse tables and entities.
Data Model: Dataverse uses a structured data model with tables, columns, and relationships, similar to a database. This makes it easy to integrate with Power BI, as you can select the relevant tables and fields for your report.
Security and Access Control: Dataverse provides security features and access control mechanisms that ensure only authorized users and applications can access the data. The Power BI Dataverse connector respects these security settings, allowing you to build secure and compliant reports.
Why other options are incorrect:
A. Microsoft Teams: While the application is hosted in Teams, Teams itself is not the data source. The data is stored in Dataverse, which is a separate service.
B. Excel workbook: Excel workbooks can be used as data sources in Power BI, but they are not the primary storage for Power Apps applications, especially those integrated with Teams.
D. Azure SQL Database: While you could potentially store Power Apps data in an Azure SQL database, it's not the default or recommended approach for Teams-integrated applications. Dataverse is the more common and integrated data storage option for such apps.
Key Takeaway: This question highlights the connection between Power Apps, Dataverse, and Power BI. When creating Power BI reports that need to access data from Power Apps applications, especially those hosted in Microsoft Teams, the Dataverse connector is the most appropriate choice. It provides seamless integration with Dataverse, allowing you to easily access, analyze, and visualize the data from your Power Apps applications in Power BI.