
Microsoft Certified: Power Platform Functional Consultant Associate - (PL-200) Exam Questions
Total Questions
Last Updated
1st Try Guaranteed

Experts Verified
Question 11 Single Choice
Identify the missing word(s) in the following sentence within the context of Microsoft Dataverse.
Microsoft Dataverse is designed to let you quickly and easily create a data model for your application, based on the tables and the table metadata that you include in your app.
[?] build out an app screen-by-screen by adding logic and code as you go.
Explanation

Click "Show Answer" to see the explanation here
Model-driven apps
Unlike canvas apps, where you build out an app screen-by-screen by adding logic and code as you go, model-driven apps can be created with a few simple steps. Model-driven apps use a component-focused approach to develop the app. When developing canvas apps, you have complete control over the appearance and behaviour of your app, whereas, with model-driven apps, the layout is mainly based on the components that you add to the app.
With model-driven apps, a number of different components and component properties are available for you to add and modify when designing an app.
Model-driven app design provides the following benefits:
Rich component-focused, no-code design environments
An ability to create complex responsive apps with a similar UI across a variety of devices from desktop to mobile
Robust design capability
Apps can be distributed as a solution
Explanation
Model-driven apps
Unlike canvas apps, where you build out an app screen-by-screen by adding logic and code as you go, model-driven apps can be created with a few simple steps. Model-driven apps use a component-focused approach to develop the app. When developing canvas apps, you have complete control over the appearance and behaviour of your app, whereas, with model-driven apps, the layout is mainly based on the components that you add to the app.
With model-driven apps, a number of different components and component properties are available for you to add and modify when designing an app.
Model-driven app design provides the following benefits:
Rich component-focused, no-code design environments
An ability to create complex responsive apps with a similar UI across a variety of devices from desktop to mobile
Robust design capability
Apps can be distributed as a solution
Question 12 Single Choice
In general, a DLP policy includes many popular Office 365 connectors.

This DLP policy includes many popular Office 365 connectors.
Other connectors exist that administrators should consider including, even though they are not related to Office 365.

In some circumstances, the above connectors might be useful for general purposes, like Approvals and Content Conversion, while others are available to help protect the organization through the automation of cybersecurity processes.
Which of the following is a valid rationale for including Power Platform and security-related connectors for Administrators and Cyber Security Analysts?
Explanation
Click "Show Answer" to see the explanation here
DLP policy and considerations
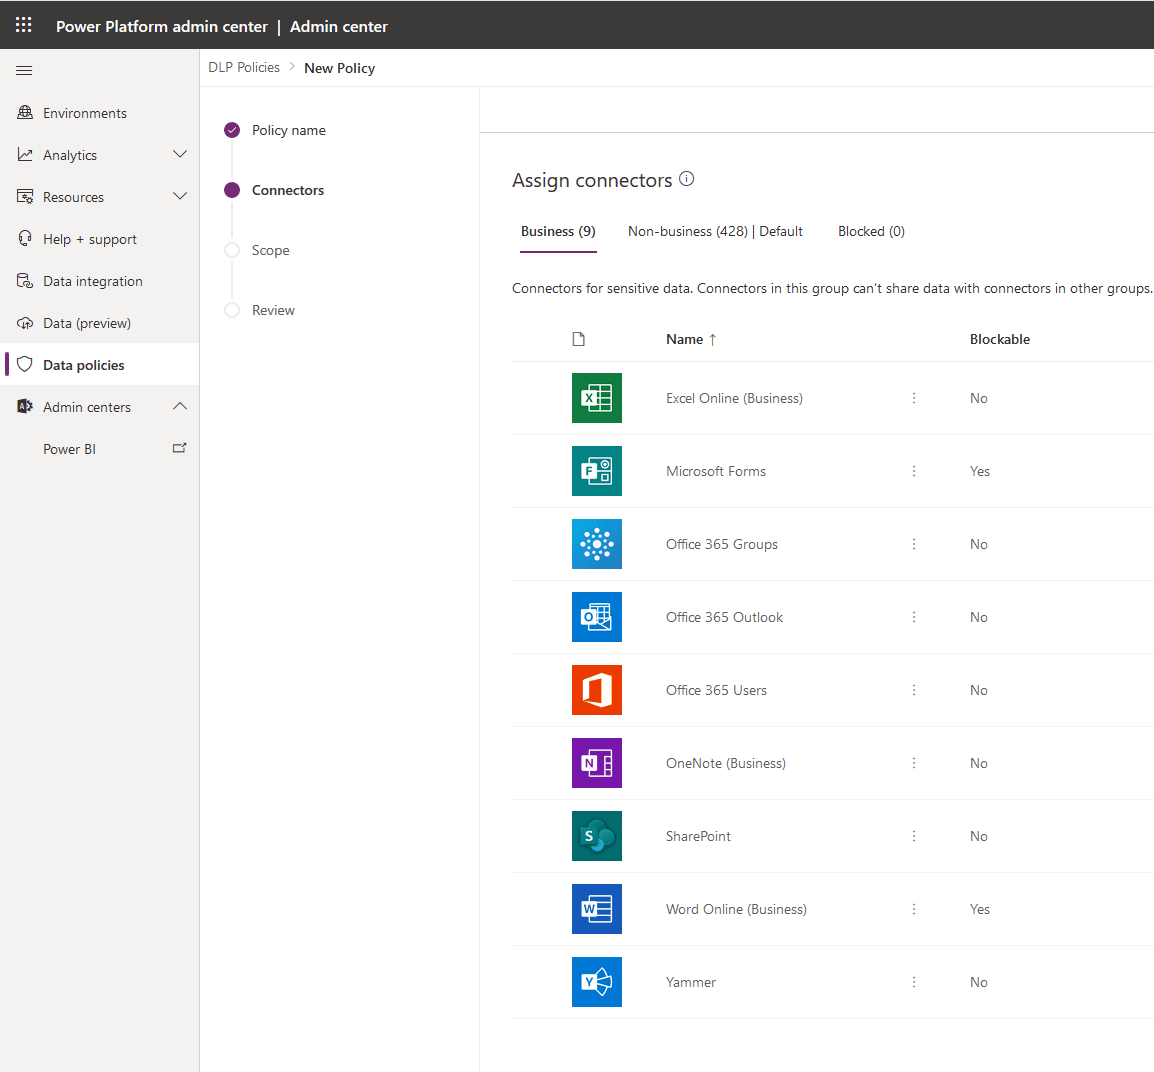
This DLP policy includes many popular Office 365 connectors.
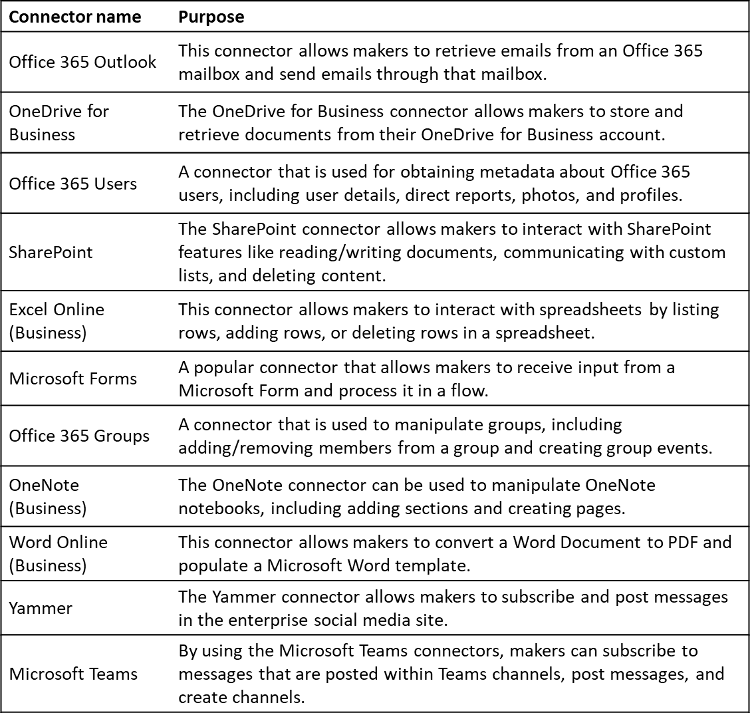
While the preceding connectors represent connectors that are related to Office 365 services, other connectors exist that administrators should consider including, even though they are not related to Office 365.
In some circumstances, the following connectors might be useful for general purposes, like Approvals and Content Conversion, while others are available to help protect the organization through the automation of cybersecurity processes.
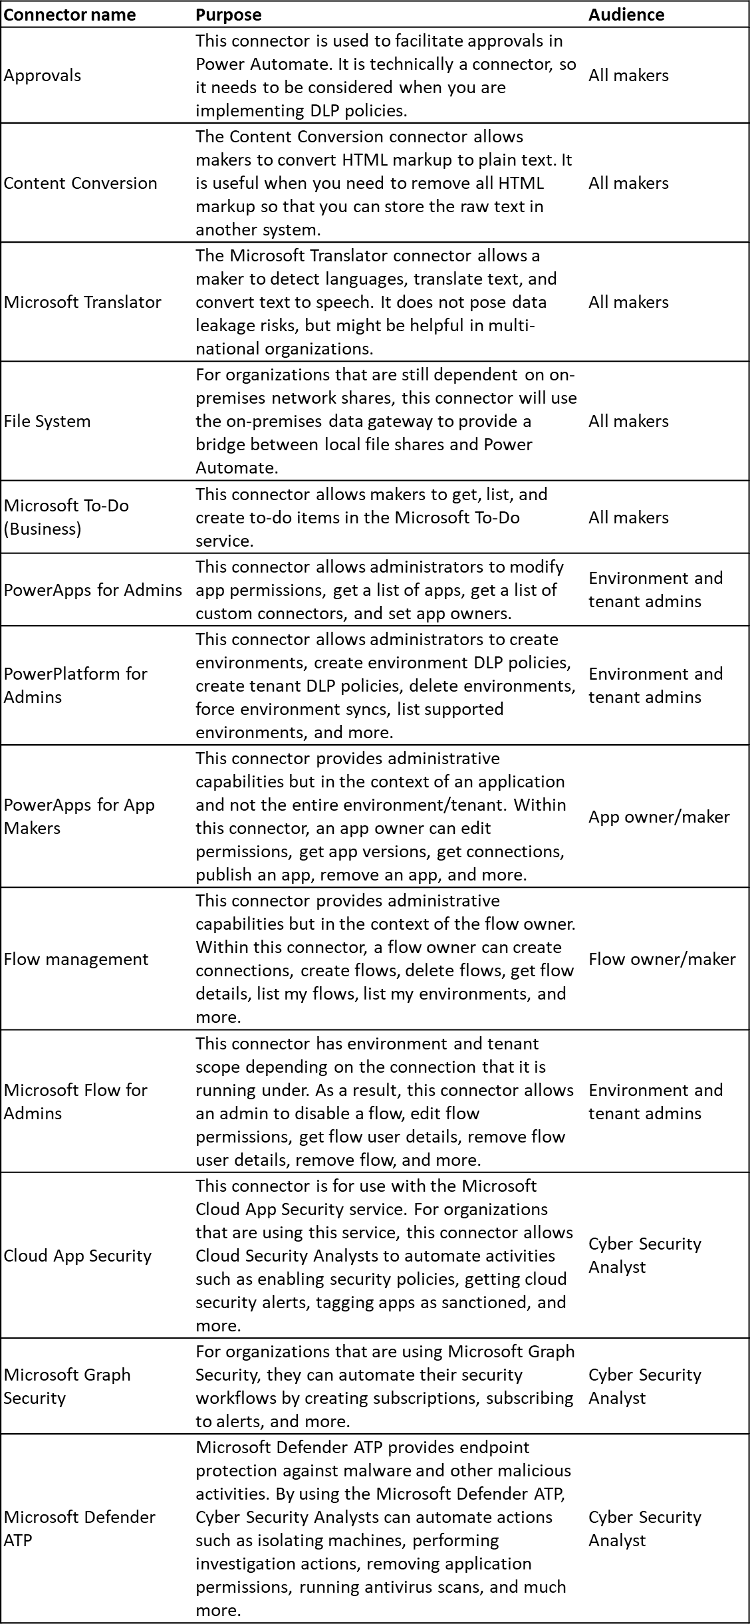
You might wonder why Power Platform and security-related connectors have been included in the previous list. The rationale is that automating workloads shouldn't be restricted to app makers. Administrators and Cyber Security Analysts also have increasing demands on their time and they should be as efficient as possible.
When it comes to cybersecurity, you can no longer rely solely on analysts querying logs 24 hours a day. By taking advantage of triggers for these security services, alerts and notifications can be sent to these teams where they can subsequently respond to emerging threats in near or real-time.
For some organizations, getting buy-in from security teams so they can use Power Platform might be challenging. However, when Cyber Security Analysts have seen the benefits and that it could solve their own needs, they generally are more open to extending its use to other areas of the organization.
Explanation
DLP policy and considerations
This DLP policy includes many popular Office 365 connectors.
While the preceding connectors represent connectors that are related to Office 365 services, other connectors exist that administrators should consider including, even though they are not related to Office 365.
In some circumstances, the following connectors might be useful for general purposes, like Approvals and Content Conversion, while others are available to help protect the organization through the automation of cybersecurity processes.
You might wonder why Power Platform and security-related connectors have been included in the previous list. The rationale is that automating workloads shouldn't be restricted to app makers. Administrators and Cyber Security Analysts also have increasing demands on their time and they should be as efficient as possible.
When it comes to cybersecurity, you can no longer rely solely on analysts querying logs 24 hours a day. By taking advantage of triggers for these security services, alerts and notifications can be sent to these teams where they can subsequently respond to emerging threats in near or real-time.
For some organizations, getting buy-in from security teams so they can use Power Platform might be challenging. However, when Cyber Security Analysts have seen the benefits and that it could solve their own needs, they generally are more open to extending its use to other areas of the organization.
Question 13 Single Choice
Scenario: Iceberg Lounge is Gotham's coolest nightclub and Penguin's pad for operations. It's a high-end nightclub in Gotham which acts as a legit forefront of his illegal activities.
You have been hired as a contractor for Iceberg Lounge and you are consulting on various IT functions. Oswald Cobblepot runs the show.
Today, the team is building a Power Apps solution using a Model-driven app for a fundraiser.
During the design process, the team considers the government regulations and authentication / authorization requirements such as MFA.
What is this referred to as?
Explanation
Click "Show Answer" to see the explanation here
Design model-driven apps
As an App Maker, before you begin building your Power Apps solution, it’s recommended to go through a design process. When designing your Power Apps solution, there are several different factors to consider:
Business requirements
Data Model
Business Logic
Output
By going through a simple design process, you can flush out any minor issues before they become a larger problem once the app is in production.
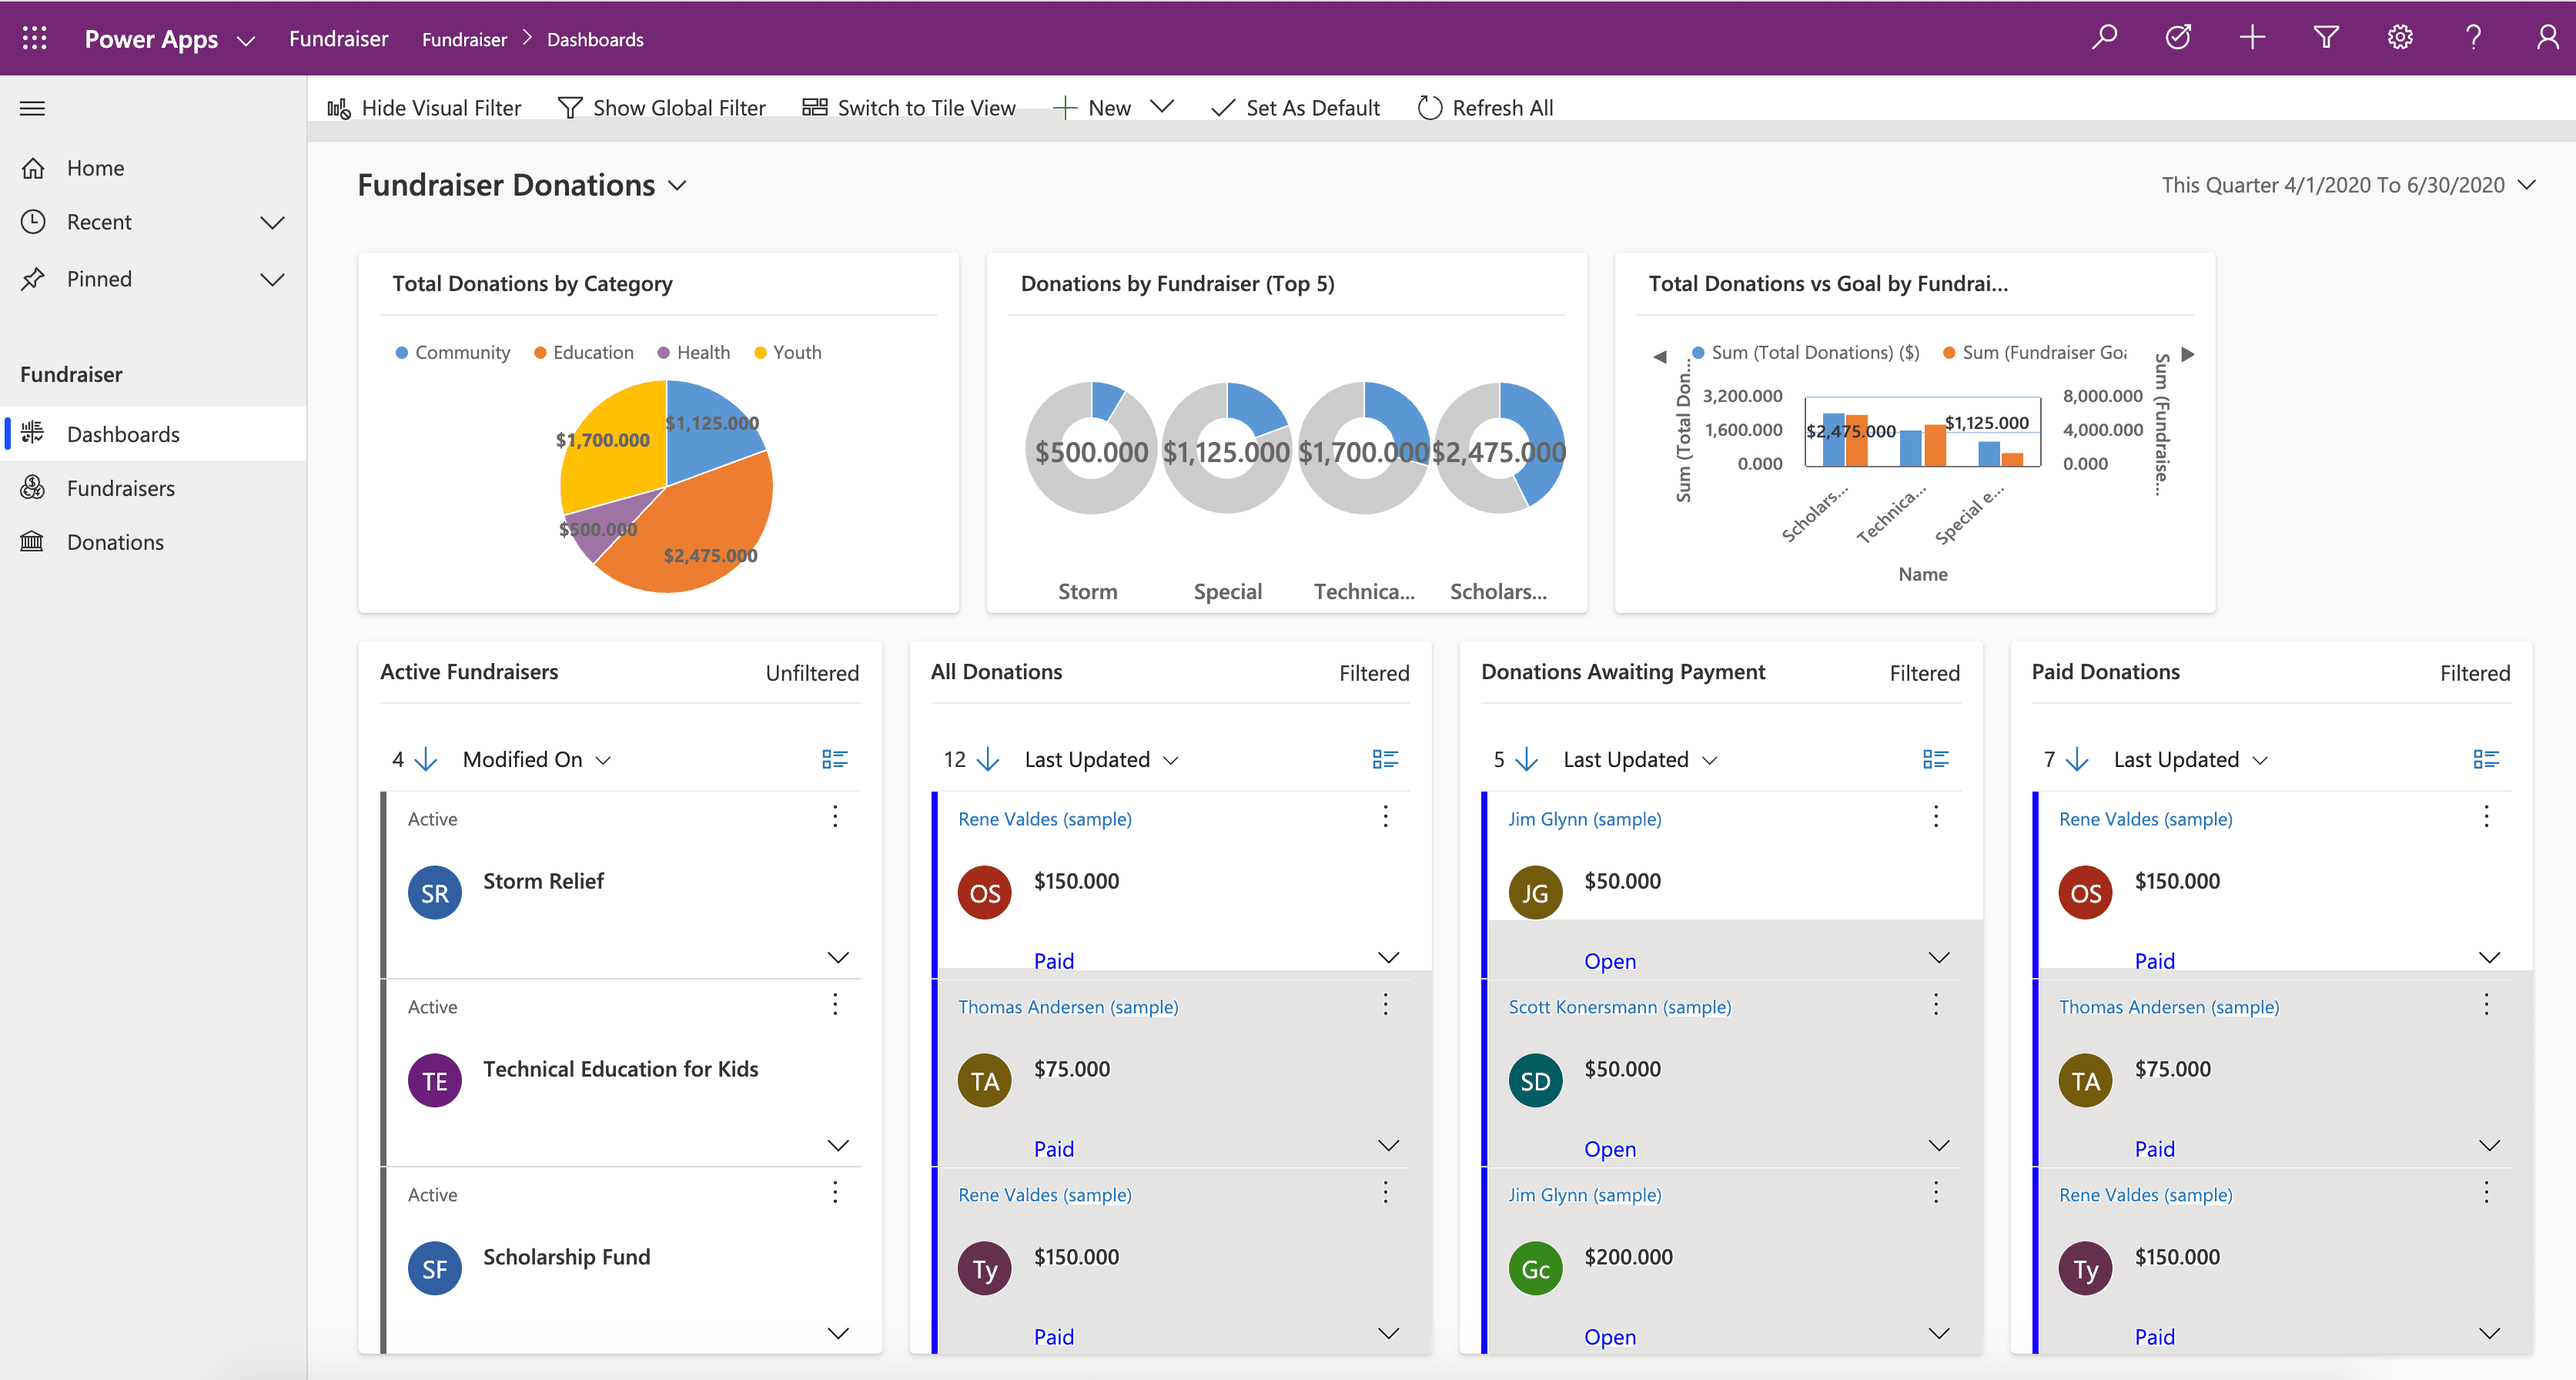
Here is a quick look at the App Designer for an example Model-driven app called “Fundraiser.”
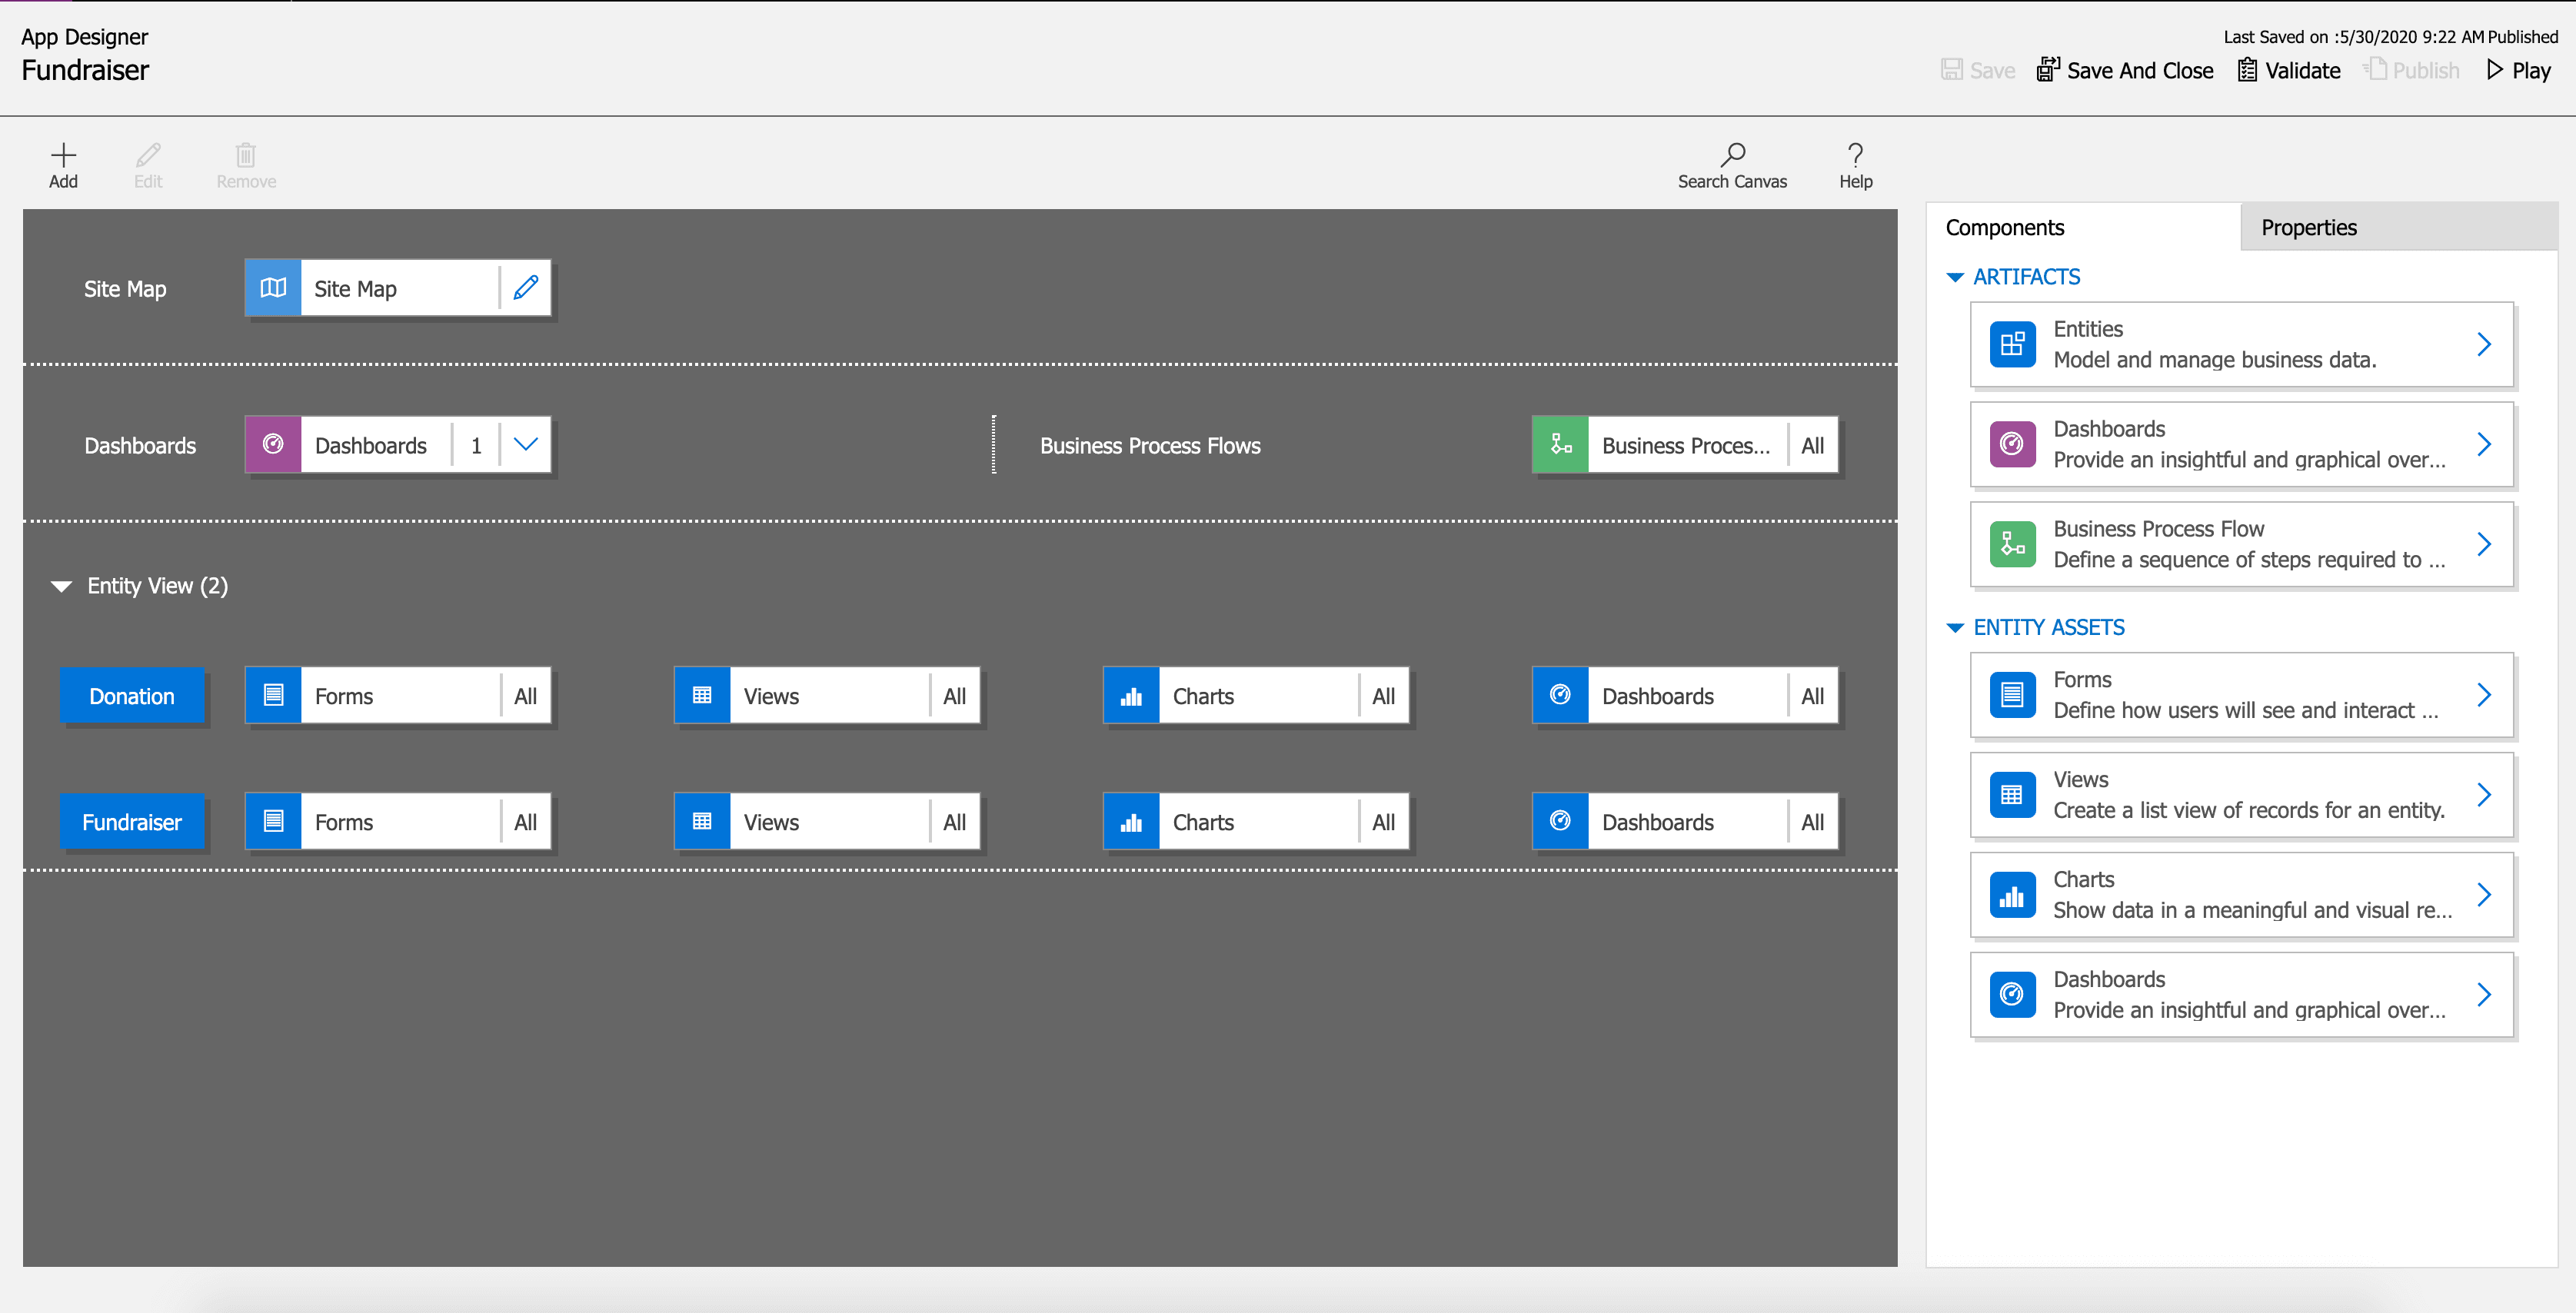
When the app is put into Play Mode, it looks completely different.

Understand the needs of the user
With Model-driven apps, the name says it all. Your primary design goal is to get your Microsoft Dataverse data model in order. With that in place, you can connect Power Apps, and a Model-driven app will be created for you from that model.
Model-driven apps are created using the App Designer. You will choose the tables, dashboards, Business Process flows, forms, and other components that you want to make available in your app, and then the app will be created for you. This means you will need to spend more time understanding what your user needs than how it is going to look.
Business Requirements
The first step in the process is to understand your business requirements. Work with the app stakeholders to consider your security, accessibility, data, and design needs.
For security, the Dataverse has a robust security model. You will want to consider how securing your app’s data affects your app and what security model best supports your business needs. There are lots of options available, including hierarchy security, row-level security, to name a few. You will need to confirm your data is secured to meet your needs, and then your app will honor that security. For more information, see Security in Dataverse.
During this process, you will also want to identify any government regulations or authentication/authorization requirements (if applicable). You may want to implement multi-factor authentication but will need to think about how this will affect users connecting to your application. You don’t necessarily have to have all the answers to your questions here; you just want to flush out all of the requirements.
Finally, does your app need to be available when the user is disconnected from the internet? This is called Offline Mode and is supported by the Dataverse and Model-driven apps when using iOS or Android clients. It does require additional design considerations. For more information, see Set up mobile offline synchronization.
Data Model
As you begin the data modelling process, there are a couple of important questions to ask yourself:
What type of data will your solution be storing and or collecting?
How will this data relate or coincide with the other data you are working with?
These questions are important when designing a model-driven application because of how model-driven applications function. Remember, model-driven applications use a metadata-driven architecture. This means a large portion of the model-driven app is based on how your data is modeled, and there is no need to write custom code to alter the app design. To expand on this a little further, when thinking about Metadata this simply means “data about data” and this data defines the structure stored in the system.
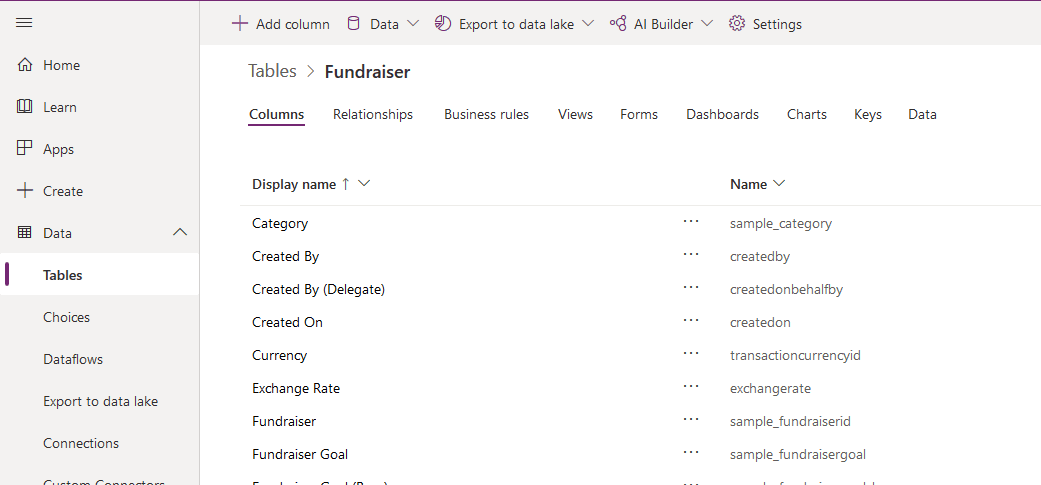
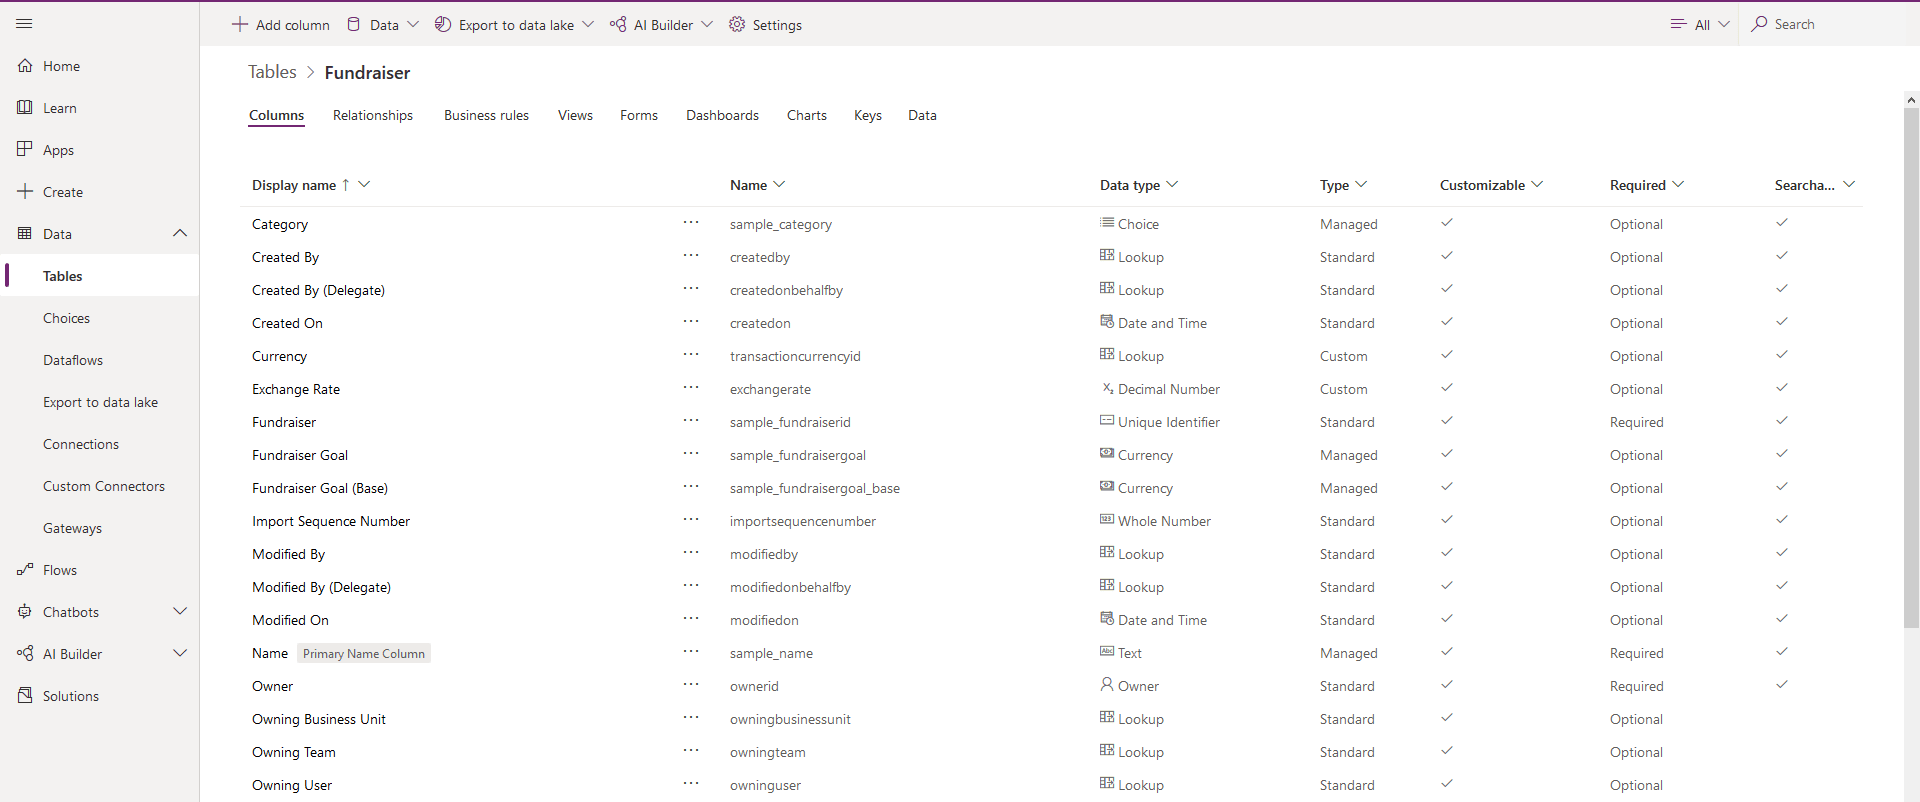
You can view the app metadata by reviewing the table in the Dataverse.
You can also view the app metadata by putting the app in Play mode.
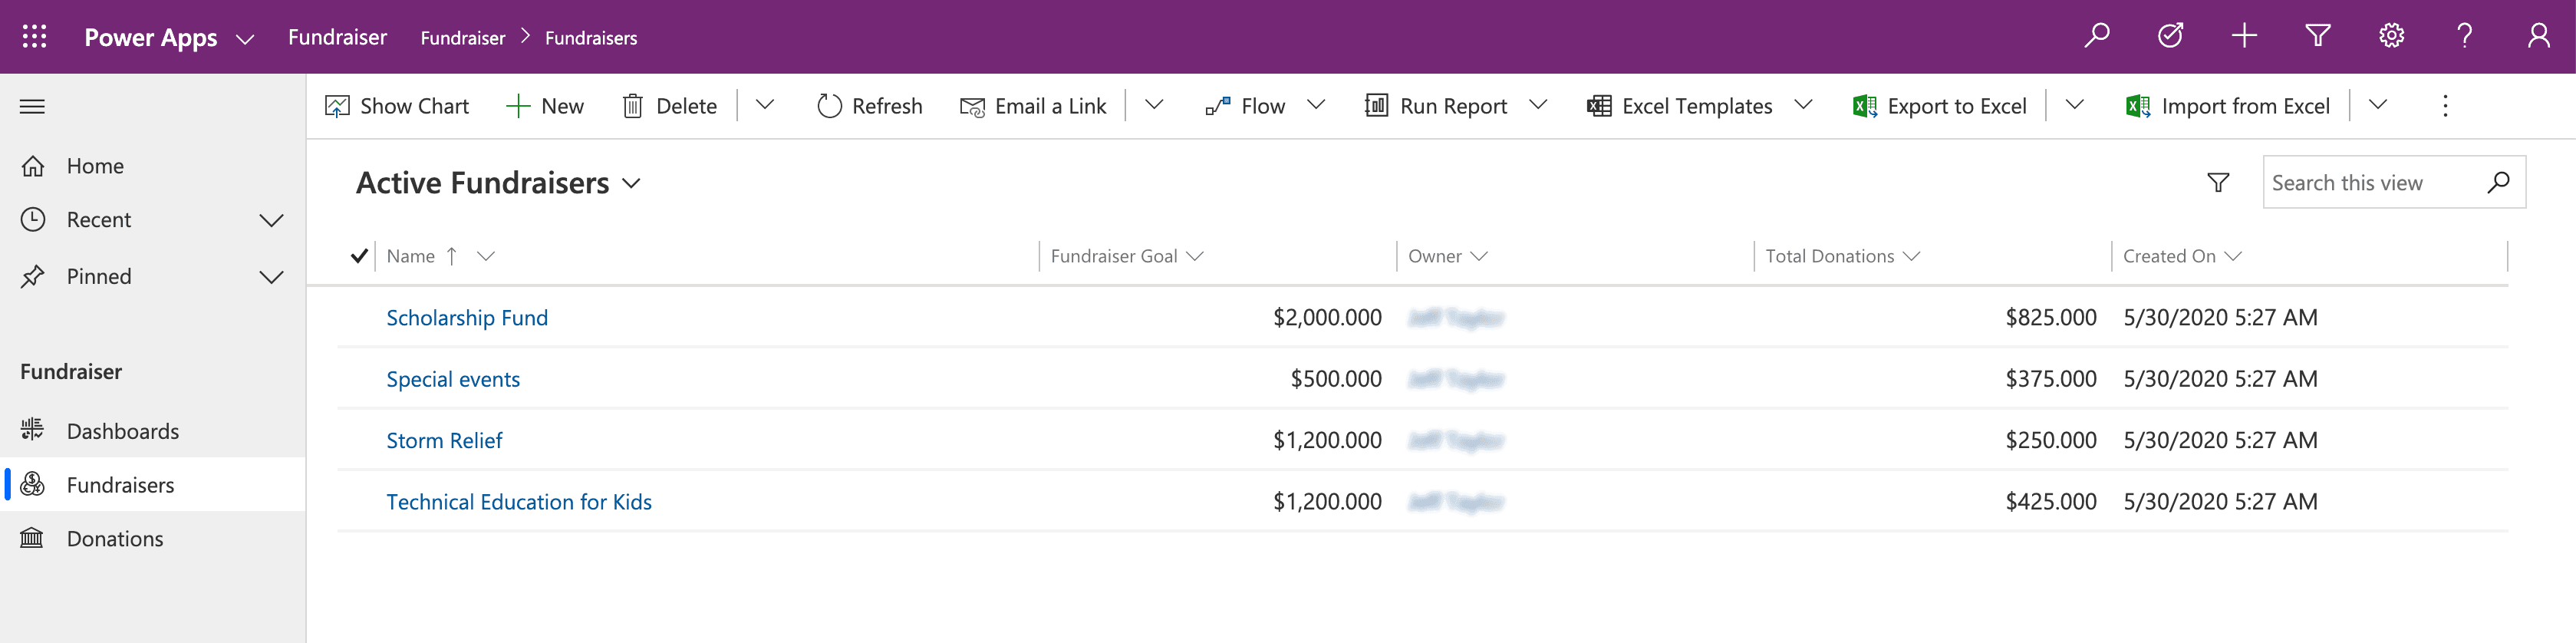
In the example above, for the Fundraiser table, there are several pieces of metadata being collected, such as:
Name
Fundraiser Goal
Owner
Total Donations
Created On
Each solution you develop and deploy will have its own set of metadata to collect. This basic understanding of metadata is important as you continue the design process and modelling your app data.
As you think about your data model also think about column types. When adding columns to your table in the Dataverse, the column type you choose will determine how users enter and view that in your Model-driven app. Option sets show as dropdowns, currency shows with currency symbols, while decimal numbers don’t. These little changes in the table can have a profound effect on how your user experiences your app.
Note: If a column type needs to be changed to a different column type, (i.e. text column to an option set), then you will need to delete that column and recreate it with the correct column type. This will cause you to lose any data associated with that column.
User Interface (UI) and User Experience (UX)
When building a Model-driven app, most of the UI and UX are predetermined for you. You define the data model to build from, and then Power Apps determines the controls used in the app. You can influence these controls by determining what table assets you include. You define in the App Designer What Forms, Views, Charts, and Dashboards are used in the app. You also control the navigation options via the Site Map. As you are planning your app, determine which components are needed in the app design, and create them before building your app.
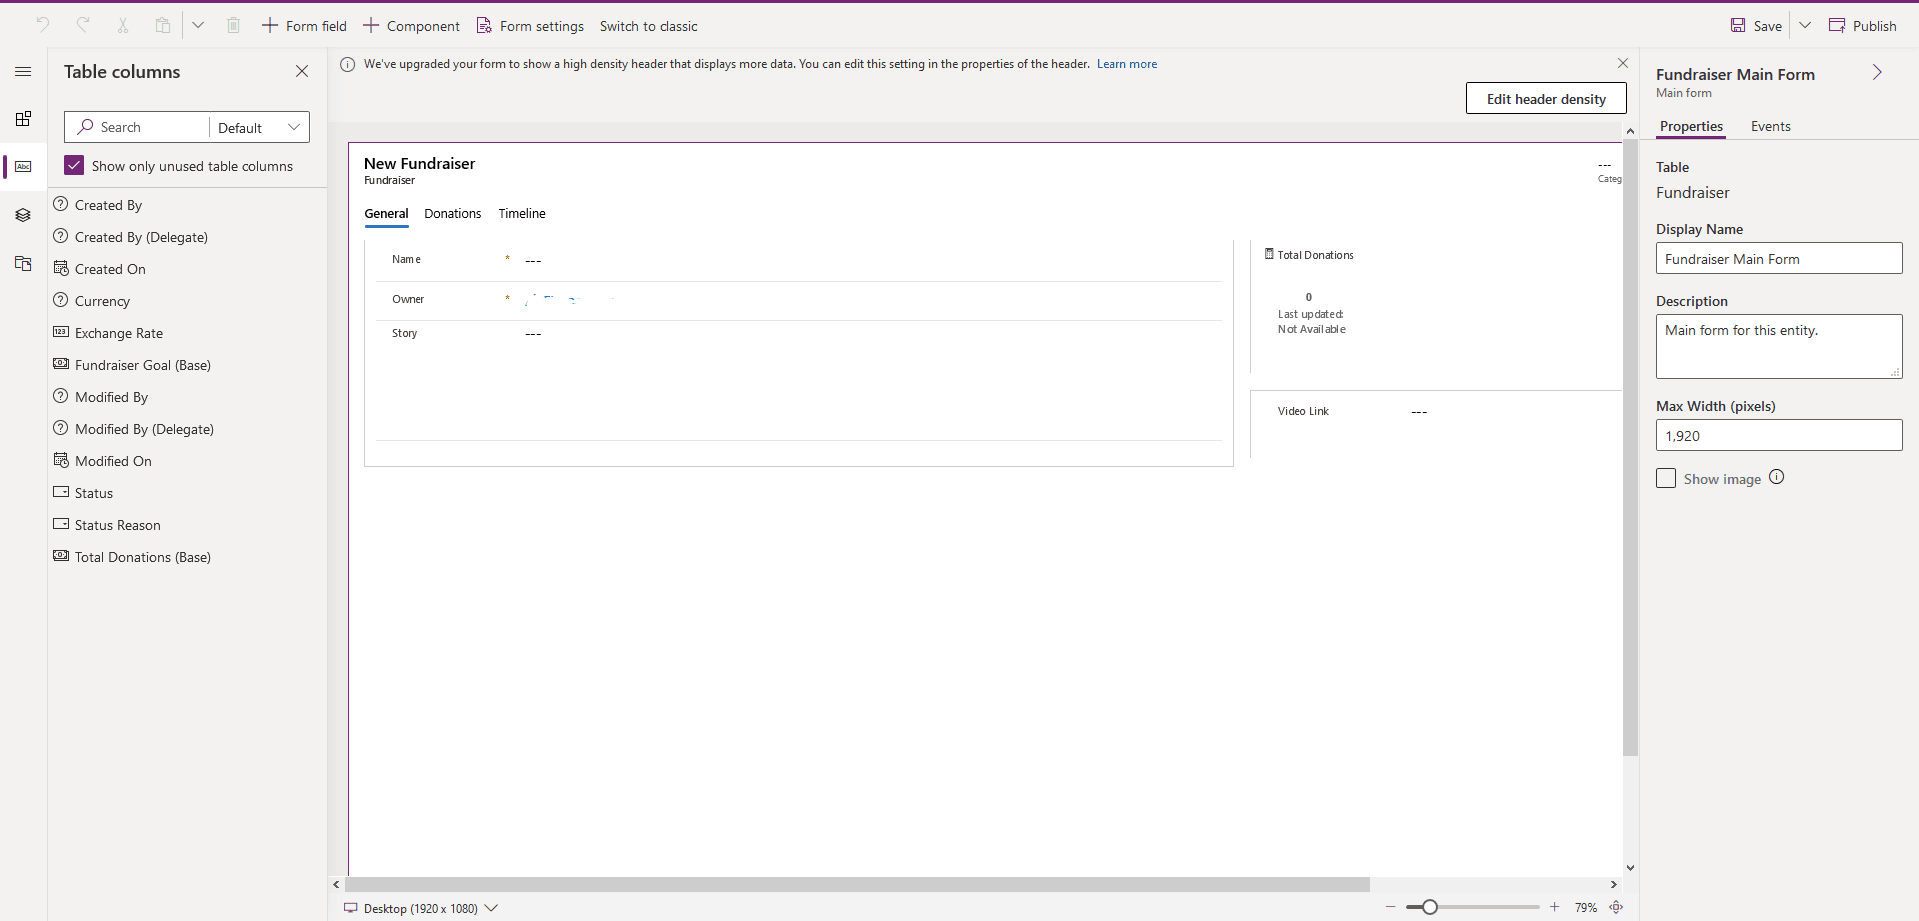
To continue building off of the example we’ve been using throughout this module, below is a simple Model-driven Form, which captures various pieces of information for creating a New Fundraiser.
Here is an example of what the New Fundraiser form looks like when editing from the App Designer.
Business Logic
When incorporating business logic in your app, there are two primary options available. You can set Business Rules on your Dataverse tables or you can build Business Process Flows.
With Business Rules, you will define behaviours at the data layer. This is great for changing when a column is required, setting a default value, or even showing or hiding a column based on criteria. An example could be a table for tracking expenses. You could have a column for the type of travel and then build a business rule that says if they choose an automobile then the mileage column is required, else it is optional. This gives you great power to make sure you maintain data consistency in all scenarios.
Business Process Flows are used to guide users through using your app. These workflows can provide visuals on the next steps based on the status of the data and facilitate other actions that you want to occur as the user uses the app. Business Process Flows let you bring automation to your app and make it more of a guided experience than just a place to enter data.
Output
A common output need for apps is to visualize the data. For this requirement, you can implement Dashboards with custom filters and visual graphics to tie all of this data together right in your app. When creating your Dashboards, make sure it’s simple for your users to consume without overwhelming them with all the data. Provide high-level snapshots of your data and allow them to use filters to dive deeper into the data if needed.

Additional third-party solutions and app accelerators
It is also important to know about the different App accelerators and third-party solutions available to you. Depending on the industry you are in, Health, Financial, Banking, Education, Non- Profit, Automotive, or Media, Microsoft has released a number of accelerators or foundational components to assist you with quickly standing up your solution.
Explanation
Design model-driven apps
As an App Maker, before you begin building your Power Apps solution, it’s recommended to go through a design process. When designing your Power Apps solution, there are several different factors to consider:
Business requirements
Data Model
Business Logic
Output
By going through a simple design process, you can flush out any minor issues before they become a larger problem once the app is in production.
Here is a quick look at the App Designer for an example Model-driven app called “Fundraiser.”
When the app is put into Play Mode, it looks completely different.
Understand the needs of the user
With Model-driven apps, the name says it all. Your primary design goal is to get your Microsoft Dataverse data model in order. With that in place, you can connect Power Apps, and a Model-driven app will be created for you from that model.
Model-driven apps are created using the App Designer. You will choose the tables, dashboards, Business Process flows, forms, and other components that you want to make available in your app, and then the app will be created for you. This means you will need to spend more time understanding what your user needs than how it is going to look.
Business Requirements
The first step in the process is to understand your business requirements. Work with the app stakeholders to consider your security, accessibility, data, and design needs.
For security, the Dataverse has a robust security model. You will want to consider how securing your app’s data affects your app and what security model best supports your business needs. There are lots of options available, including hierarchy security, row-level security, to name a few. You will need to confirm your data is secured to meet your needs, and then your app will honor that security. For more information, see Security in Dataverse.
During this process, you will also want to identify any government regulations or authentication/authorization requirements (if applicable). You may want to implement multi-factor authentication but will need to think about how this will affect users connecting to your application. You don’t necessarily have to have all the answers to your questions here; you just want to flush out all of the requirements.
Finally, does your app need to be available when the user is disconnected from the internet? This is called Offline Mode and is supported by the Dataverse and Model-driven apps when using iOS or Android clients. It does require additional design considerations. For more information, see Set up mobile offline synchronization.
Data Model
As you begin the data modelling process, there are a couple of important questions to ask yourself:
What type of data will your solution be storing and or collecting?
How will this data relate or coincide with the other data you are working with?
These questions are important when designing a model-driven application because of how model-driven applications function. Remember, model-driven applications use a metadata-driven architecture. This means a large portion of the model-driven app is based on how your data is modeled, and there is no need to write custom code to alter the app design. To expand on this a little further, when thinking about Metadata this simply means “data about data” and this data defines the structure stored in the system.
You can view the app metadata by reviewing the table in the Dataverse.
You can also view the app metadata by putting the app in Play mode.
In the example above, for the Fundraiser table, there are several pieces of metadata being collected, such as:
Name
Fundraiser Goal
Owner
Total Donations
Created On
Each solution you develop and deploy will have its own set of metadata to collect. This basic understanding of metadata is important as you continue the design process and modelling your app data.
As you think about your data model also think about column types. When adding columns to your table in the Dataverse, the column type you choose will determine how users enter and view that in your Model-driven app. Option sets show as dropdowns, currency shows with currency symbols, while decimal numbers don’t. These little changes in the table can have a profound effect on how your user experiences your app.
Note: If a column type needs to be changed to a different column type, (i.e. text column to an option set), then you will need to delete that column and recreate it with the correct column type. This will cause you to lose any data associated with that column.
User Interface (UI) and User Experience (UX)
When building a Model-driven app, most of the UI and UX are predetermined for you. You define the data model to build from, and then Power Apps determines the controls used in the app. You can influence these controls by determining what table assets you include. You define in the App Designer What Forms, Views, Charts, and Dashboards are used in the app. You also control the navigation options via the Site Map. As you are planning your app, determine which components are needed in the app design, and create them before building your app.
To continue building off of the example we’ve been using throughout this module, below is a simple Model-driven Form, which captures various pieces of information for creating a New Fundraiser.
Here is an example of what the New Fundraiser form looks like when editing from the App Designer.
Business Logic
When incorporating business logic in your app, there are two primary options available. You can set Business Rules on your Dataverse tables or you can build Business Process Flows.
With Business Rules, you will define behaviours at the data layer. This is great for changing when a column is required, setting a default value, or even showing or hiding a column based on criteria. An example could be a table for tracking expenses. You could have a column for the type of travel and then build a business rule that says if they choose an automobile then the mileage column is required, else it is optional. This gives you great power to make sure you maintain data consistency in all scenarios.
Business Process Flows are used to guide users through using your app. These workflows can provide visuals on the next steps based on the status of the data and facilitate other actions that you want to occur as the user uses the app. Business Process Flows let you bring automation to your app and make it more of a guided experience than just a place to enter data.
Output
A common output need for apps is to visualize the data. For this requirement, you can implement Dashboards with custom filters and visual graphics to tie all of this data together right in your app. When creating your Dashboards, make sure it’s simple for your users to consume without overwhelming them with all the data. Provide high-level snapshots of your data and allow them to use filters to dive deeper into the data if needed.
Additional third-party solutions and app accelerators
It is also important to know about the different App accelerators and third-party solutions available to you. Depending on the industry you are in, Health, Financial, Banking, Education, Non- Profit, Automotive, or Media, Microsoft has released a number of accelerators or foundational components to assist you with quickly standing up your solution.
Question 14 Multiple Choice
Scenario: You are working as a consultant at Advanced Idea Mechanics (A.I.M.) who is a privately funded think tank organized of a group of brilliant scientists whose sole dedication is to acquire and develop power through technological means. Their goal is to use this power to overthrow the governments of the world. They supply arms and technology to radicals and subversive organizations in order to foster a violent technological revolution of society while making a profit.
The company has 10,000 employees. Most employees are located in Europe. The company supports teams worldwide.
AIM has two main locations: the main office in London, England, and a manufacturing plant in Berlin, Germany.
At the moment, you are leading a Workgroup meeting with the IT Team where the topic of discussion is Microsoft Dataverse environments. Since AIM is beginning its Microsoft Dataverse and you were hired as an Expert Consultant, the team is looking to you for direction.
During the meeting, it becomes clear there is much confusion around the topic as some of the team members have a good understanding of Dataverse and some do not.
Below is a collection of statements made at the meeting. Some are correct, some are not.
As the Expert, it is up to you to set the record straight. Which of the below are true statements? (Select all that apply)
Explanation
Click "Show Answer" to see the explanation here
Environments are used to store, manage, and share your organization's business data, apps, and flows in Power Platform. Each environment allows you to provision one Microsoft Dataverse database for use within that environment. Microsoft Dataverse environments allow you to manage user access, security settings, and the storage that is associated with that database.
Each environment is created under a Microsoft Azure Active Directory (Azure AD) tenant, and its resources can only be accessed by users within that tenant. An environment is also bound to a geographic location, like the United States. When you create a Microsoft Dataverse database in an environment, that database is created within datacentres in that geographic location. Any items that you create in that environment (including connections, gateways, flows that are using Power Automate, and more) are also bound to their environment's location.
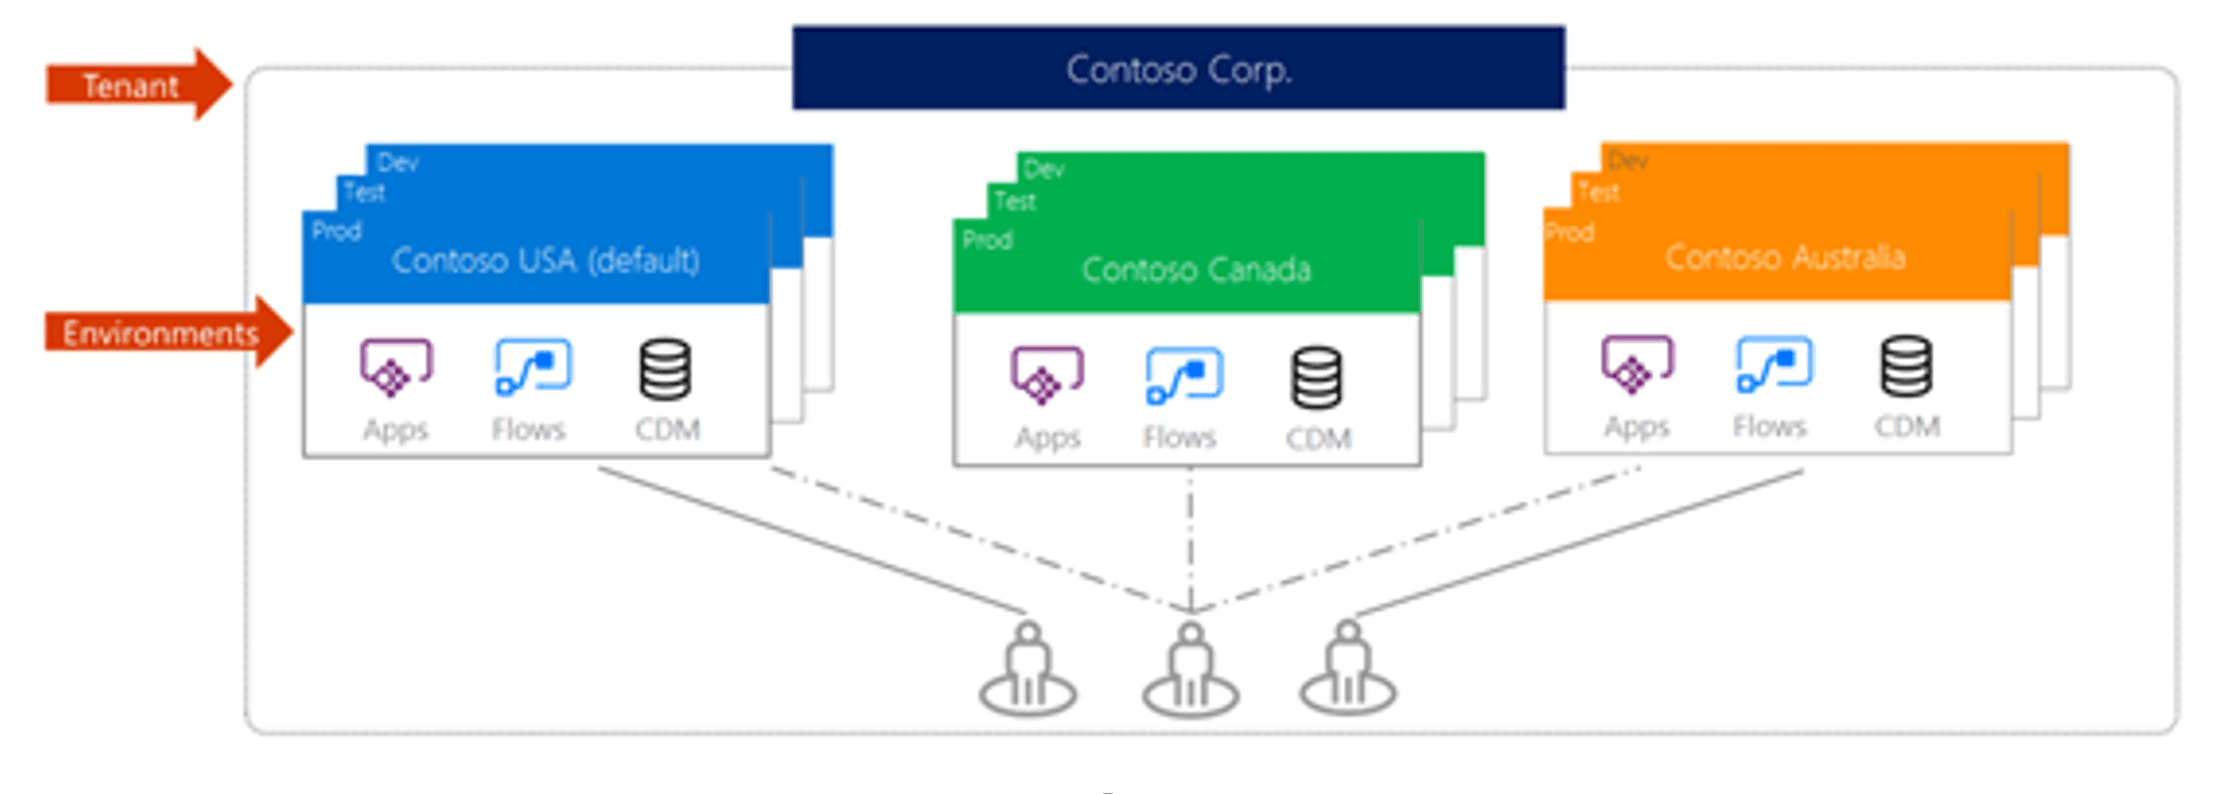
You can create more than one environment to manage solution development and data storage by setting up one environment for development, another for testing, and another for production use. Also, you can set up an environment based on a geographical location. For example, you might set up an environment for Europe and another for Asia. Each of these environments will have zero or only one instance of Microsoft Dataverse.
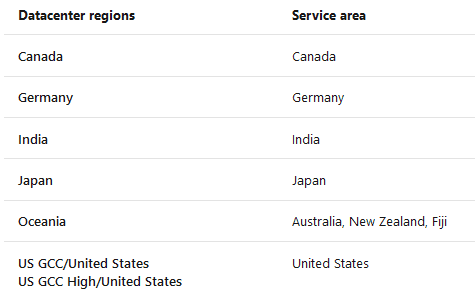
Datacenter regions
The customer engagement apps (Dynamics 365 Sales, Dynamics 365 Customer Service, Dynamics 365 Field Service, Dynamics 365 Marketing, and Dynamics 365 Project Service Automation), are being hosted in datacentres in more and more regions. After customer engagement apps become available in a new region, the following apply:
For new organizations, the datacentre will be aligned with the country/region you selected during sign-up.
For existing organizations, Microsoft will soon accommodate migrations to datacentres in the new region when requested by the customer as long as the organization meets certain business requirements.
The following table lists the newest datacentre regions.
Explanation
Environments are used to store, manage, and share your organization's business data, apps, and flows in Power Platform. Each environment allows you to provision one Microsoft Dataverse database for use within that environment. Microsoft Dataverse environments allow you to manage user access, security settings, and the storage that is associated with that database.
Each environment is created under a Microsoft Azure Active Directory (Azure AD) tenant, and its resources can only be accessed by users within that tenant. An environment is also bound to a geographic location, like the United States. When you create a Microsoft Dataverse database in an environment, that database is created within datacentres in that geographic location. Any items that you create in that environment (including connections, gateways, flows that are using Power Automate, and more) are also bound to their environment's location.
You can create more than one environment to manage solution development and data storage by setting up one environment for development, another for testing, and another for production use. Also, you can set up an environment based on a geographical location. For example, you might set up an environment for Europe and another for Asia. Each of these environments will have zero or only one instance of Microsoft Dataverse.
Datacenter regions
The customer engagement apps (Dynamics 365 Sales, Dynamics 365 Customer Service, Dynamics 365 Field Service, Dynamics 365 Marketing, and Dynamics 365 Project Service Automation), are being hosted in datacentres in more and more regions. After customer engagement apps become available in a new region, the following apply:
For new organizations, the datacentre will be aligned with the country/region you selected during sign-up.
For existing organizations, Microsoft will soon accommodate migrations to datacentres in the new region when requested by the customer as long as the organization meets certain business requirements.
The following table lists the newest datacentre regions.
Question 15 Single Choice
Identify the missing word(s) in the following sentence within the context of Microsoft Power Platform.
Scenario: The British East India Company (EIC), was a British joint-stock company, formed in the 17th century trade with the East Indies, India, and China. It helped expand British interests around the globe forming the British Empire.
They now sell goods globally which are distributed by international retail chains. EIC has hired auditors to take pictures of their products on shelves for compliance detection. The auditor takes a picture, which will then be processed by [?] to extract the numbers of each product. Those numbers are transmitted to EIC in real time to assess supermarket compliance.
Explanation
Click "Show Answer" to see the explanation here
The auditor takes a picture, which will then be processed by AI Builder to extract the numbers of each product. Those numbers are transmitted to EIC in real time to assess supermarket compliance.
AI Builder Object detection is an AI model that you can train to detect objects in pictures. AI models usually require that you provide samples of data to train before you are able to perform predictions. Prebuilt models are pre-trained by using a set of samples that are provided by Microsoft, so they are instantly ready to be used in predictions.
When you are predicting, AI Builder Object detection will recognize the objects that you submitted during the training phase with help from Azure Custom Vision Object detection technology. Object detection can detect up to 500 different objects in a single model and support JPG, PNG, BMP image format or photos through the Power Apps control.
AI Builder Object detection provides object recognition capabilities to makers. Being fully integrated with the rest of the business platform means that you can accelerate manual workflow and automate a wide range of scenarios that are currently only achieved with human intervention.
Explanation
The auditor takes a picture, which will then be processed by AI Builder to extract the numbers of each product. Those numbers are transmitted to EIC in real time to assess supermarket compliance.
AI Builder Object detection is an AI model that you can train to detect objects in pictures. AI models usually require that you provide samples of data to train before you are able to perform predictions. Prebuilt models are pre-trained by using a set of samples that are provided by Microsoft, so they are instantly ready to be used in predictions.
When you are predicting, AI Builder Object detection will recognize the objects that you submitted during the training phase with help from Azure Custom Vision Object detection technology. Object detection can detect up to 500 different objects in a single model and support JPG, PNG, BMP image format or photos through the Power Apps control.
AI Builder Object detection provides object recognition capabilities to makers. Being fully integrated with the rest of the business platform means that you can accelerate manual workflow and automate a wide range of scenarios that are currently only achieved with human intervention.
Question 16 Single Choice
Scenario: Stark Industries was founded by Howard Stark during the early twentieth century, a great pioneer in different types of technology and constantly helping the United States Armed Forces with different and innovative weapons. Some years after the death of Howard Stark, his son Tony took over the company.
Currently, in the process of making many IT improvements, you have been hired as a consultant to advise on several Microsoft Power App projects. Today, you are advising a team on Data Loss Prevention.
To begin the journey, Tony wants to download the Power Platform Centre of Excellence (COE) Starter Kit.
Where can he do this?
Explanation
Click "Show Answer" to see the explanation here
The Power Platform Centre of Excellence (COE) Starter Kit is a set of apps, flows, a custom connector, and a Power BI dashboard that allows organizations to govern their Power Platform environments. The tool is freely available for download on GitHub.
The Starter Kit is a great tool for organizations to increase the visibility of what their makers are doing in their tenant. Naturally, this tool immediately applies to two personas: Cyber Security analysts and Organizational Change Management (OCM) interests. Makers that are building applications and services that introduce risk to the organization should be monitored, but makers who are automating workloads within sanctioned systems and services should be empowered and encouraged to expand on their efforts.
The Starter Kit does have some prerequisites, including:
A global tenant admin, Power Platform Service admin, or Dynamics 365 service admin role is required to access the tenant resources.
A Power Apps premium license for accessing Microsoft Dataverse.
An environment with Dataverse because the Starter Kit solution will need to store metadata about the apps and flows that are detected within an environment.
Power BI Desktop to view the reports and visualizations that highlight the app and flow use within the tenant.
Within the Starter Kit, administrators will discover the tools and features that are discussed in the following sections.
DLP Strategy
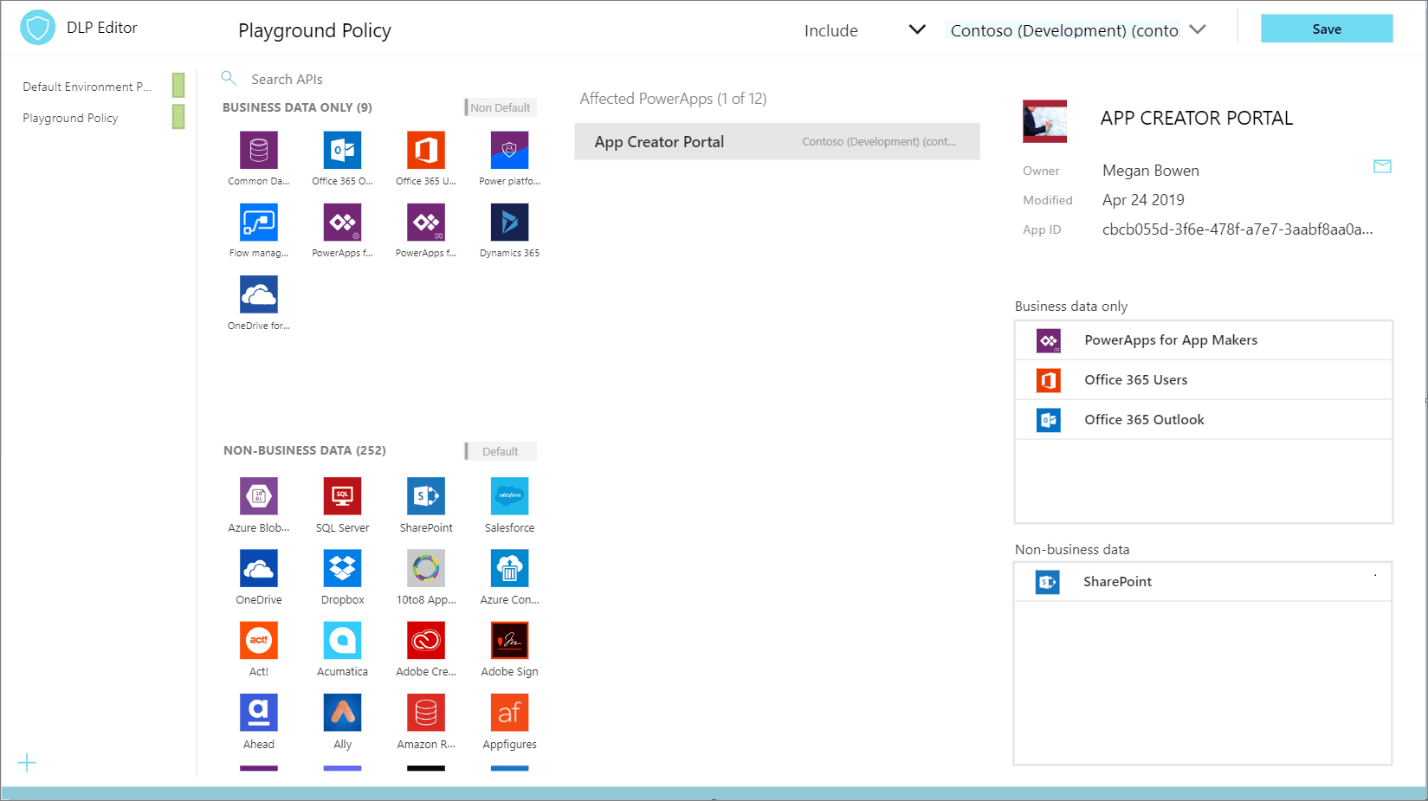
By using the DLP Editor app, an administrator can explore existing DLP policies and evaluate the impact of moving a connector from one data group to another. If a change to a data group has an impact on an existing app, that will be highlighted in the Affected Power Apps list. Then, an administrator can send an email, through an in-app experience, to the owner of that application and warn them of the upcoming change.
This current, in-product DLP editor experience doesn't provide this type of what-if analysis, so we recommend that you use the DLP Strategy app that comes with the COE Starter Kit when making DLP changes. Using the DLP Strategy app will also help you understand the impact on existing apps when DLP changes are made and help you reduce the chance of unknowingly breaking someone's app.
Catalogue tenant resources, visualize data in Power BI
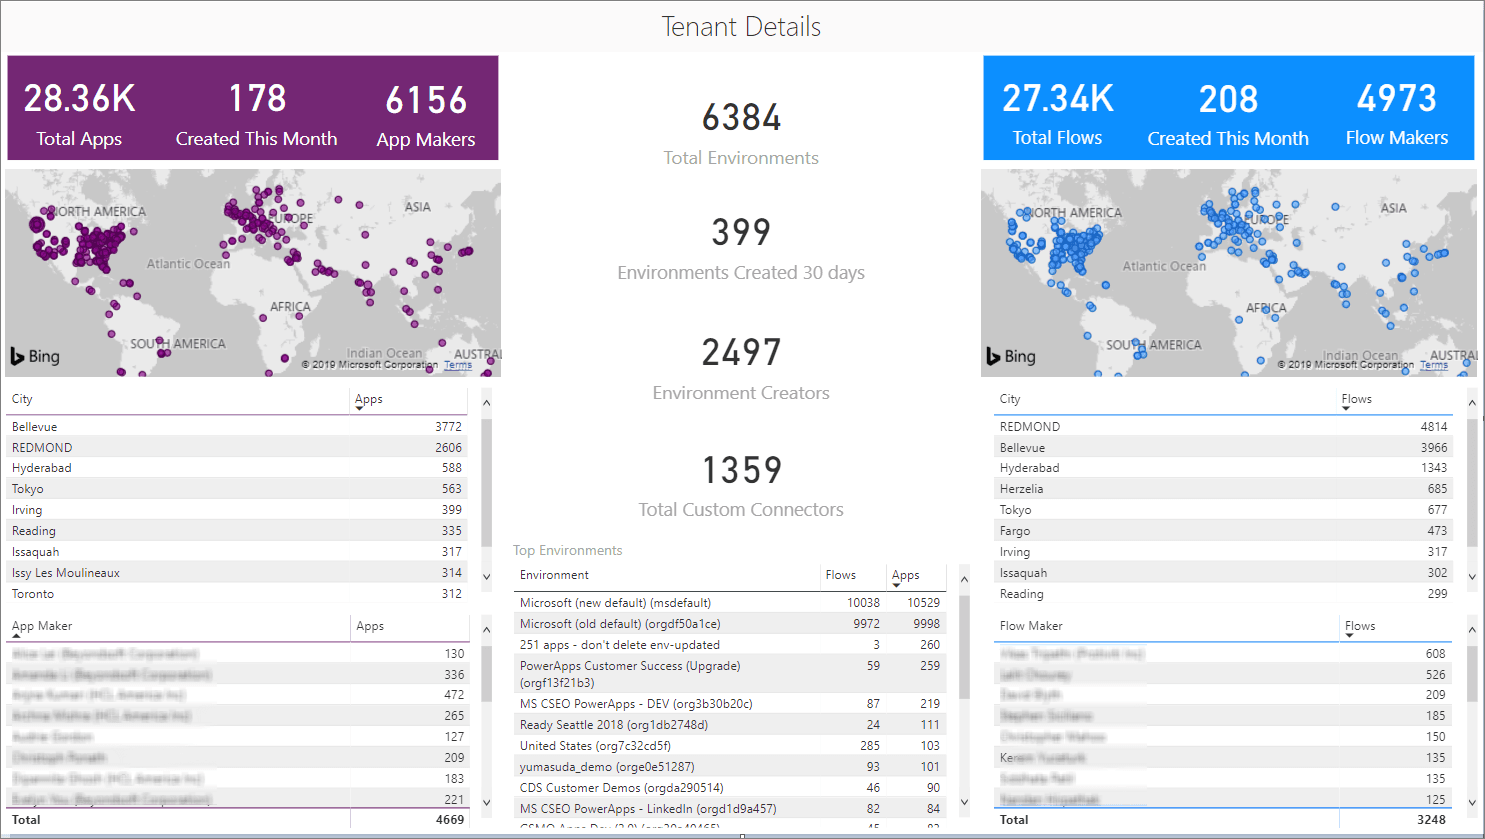
While Admin Analytics, which is found in the Power Platform Admin centre, provides some insight into the use of Power Apps and Power Automate, it does so within the context of an environment. This parameter makes developing a holistic picture of usage difficult. However, using the tools that are provided in the COE Starter Kit brings all these insights together by using Dataverse, a model-driven Power App, and a Power BI dashboard. These assets, plus the inclusion of flows that will sync data from Office 365 Security and Compliance logs and through the Power Platform management connectors into Dataverse entities, provide the greatest level of visibility for administrators.
The Power BI dashboard connects to Starter Kit Dataverse entities and contains tabs that provide the following reports:
Overview - Includes the total number of apps and flows that have been created, including a breakdown based on the maker's location and the number of apps/flows that they have created.
Environments - Highlights the number of environments that have been created and includes the type of environment (Default, Production, Sandbox, Trial), and then identifies the creators of the environments and when the environment was created.
Apps - Provides insights into the usage of apps, including the number of sessions and users that the app has been shared with. This report also breaks down usage by the department by pivoting data based on the department that has been specified inside of a user's Office 365 profile.
App detail - Examines the specifics of the app, including the connection type and when the app was last published.
Flows - Displays a flow creation trend that will break down when flows were created. This report will also pivot data based on the user's department and includes a breakdown of the flows that were created by the environment.
Custom Connectors - Lists all the custom connectors that exist within a tenant. This report also lists the users that created the connectors and then trends the month that they were created in.
Makers - Identifies all the makers within the environment and identifies how many apps and flows they have built. A slicer exists that allows a consumer of this report to filter based on the maker's department.
Connections - Displays the number of connections that have been established, by the connector. This report provides great insight into the popularity of specific connectors within your tenant.
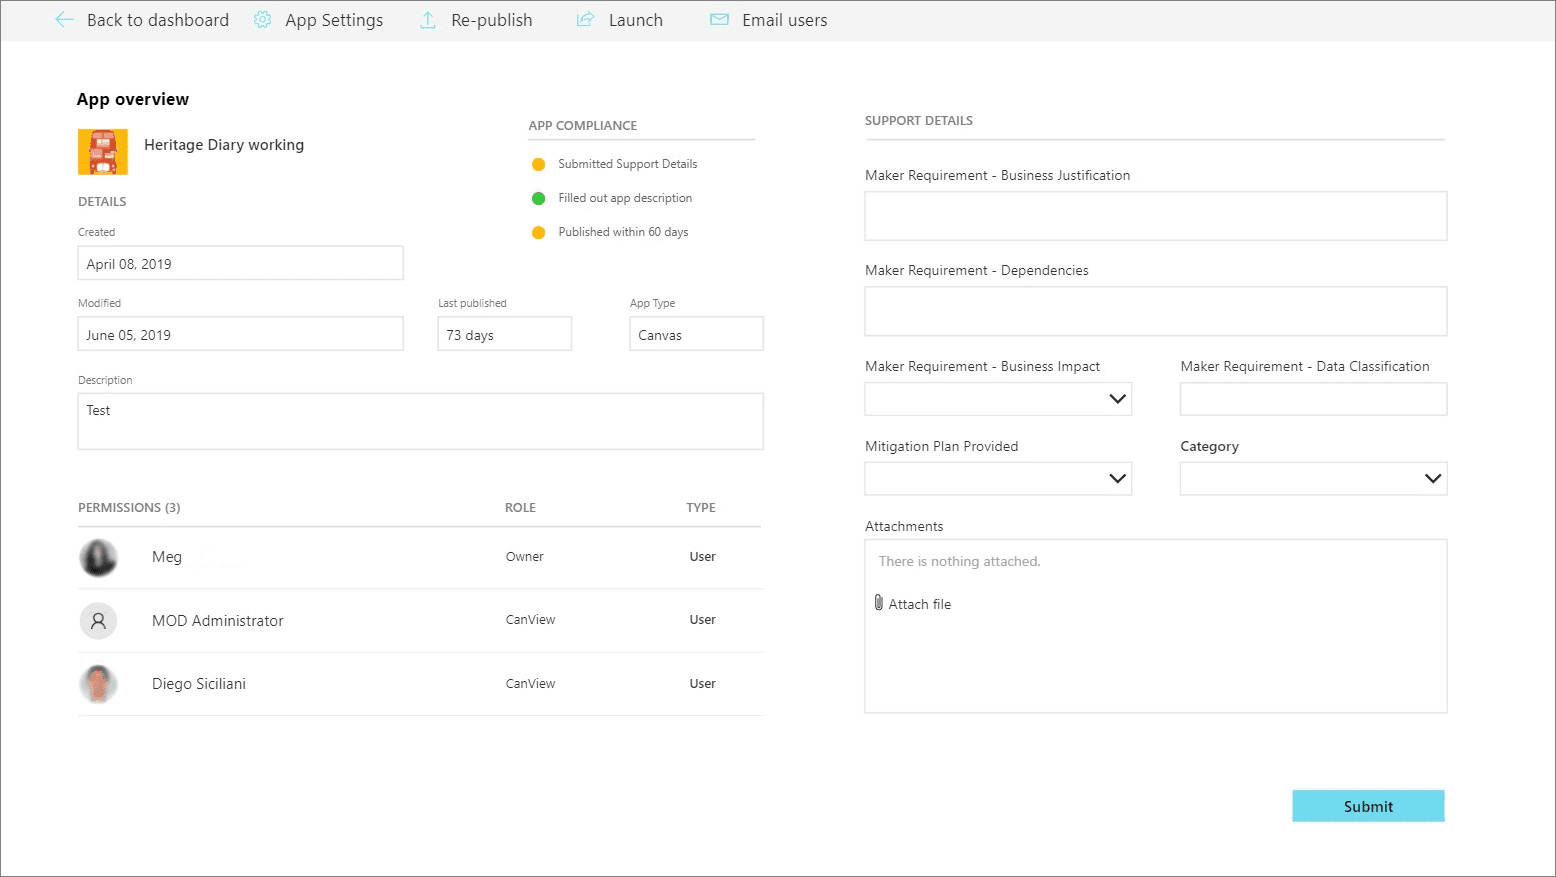
App Audit
The main purpose of the Sample App Audit process is to demonstrate how an admin could identify overshared or often used resources and gather further information, like business justification and business impact of an outage, for those apps. Having a platform that provides democratized access to technology is only useful if people don't create many redundant or low-value applications. Situations might also occur where people create temporary applications for proof-of-concept purposes. These apps can clutter an environment if they are not cleaned up. Within the COE Starter Kit, app makers can be prompted to attest their application to ensure that it addresses business justification requirements. If the application doesn't address these requirements, makers can have their application removed from the environment.
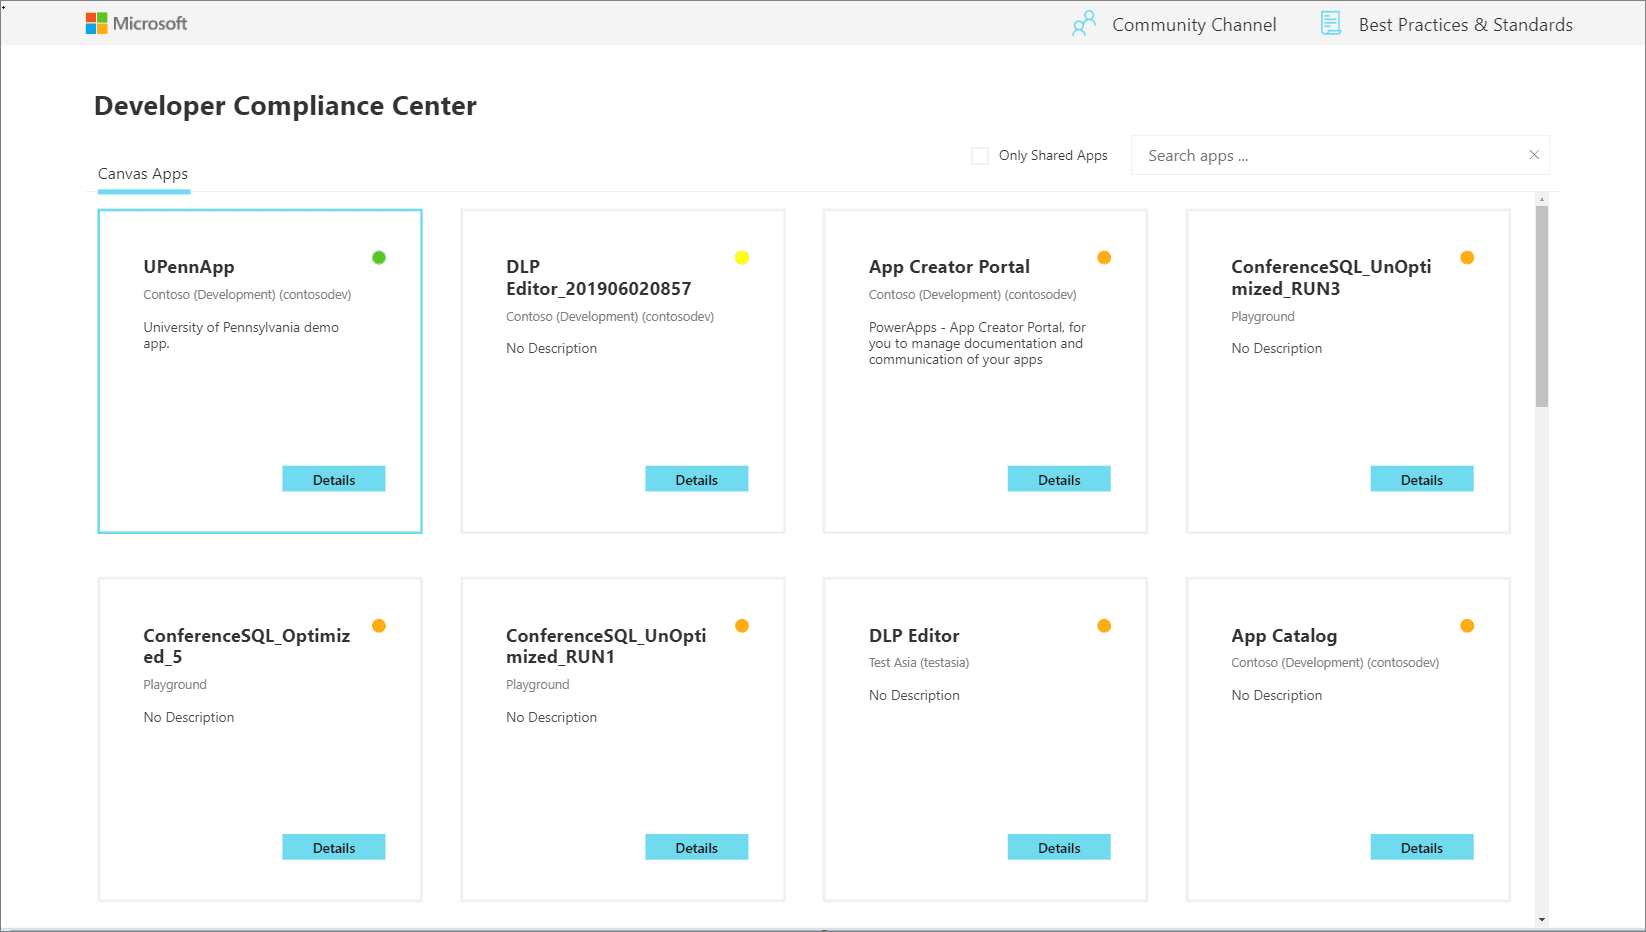
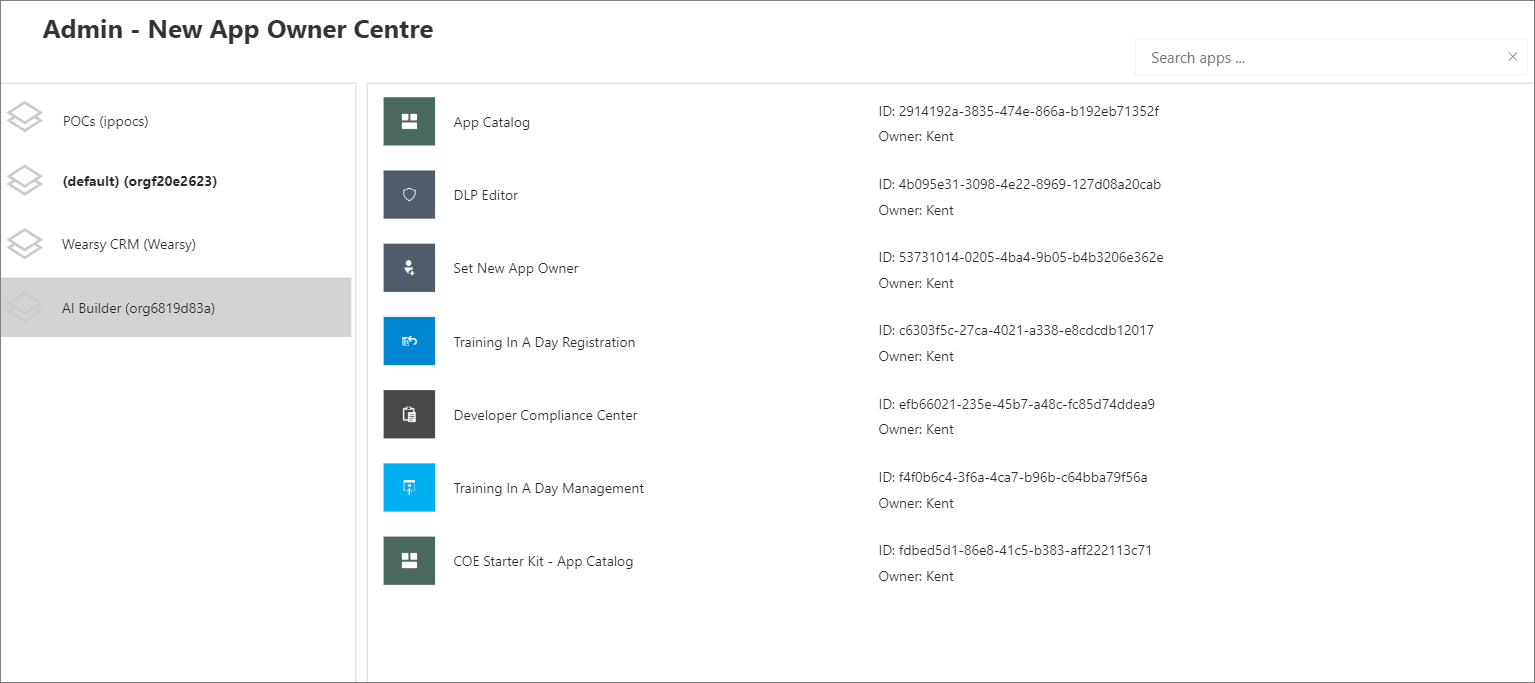
App catalogue
The App catalogue application acts as a catalogue that helps with the discoverability of apps. Users can explore featured apps and browse apps by category. The app catalogue can be a great entry point to launch apps for end users and makers can explore to see if an application already exists before they create another app that provides similar functionality. An Admin decides which apps are featured in the App catalogue by completing the App Audit process. After an app has been approved by the App Audit process, these apps can be featured in the app catalogue.
Set Owner
Administrating access to applications can be done by the Owner of the application. However, circumstances might occur where you want an administrator to provide access. By using the Set Owner app, you can allow for this situation by selecting an app, adding users, and then indicating whether they should be able to view the app or edit the app.
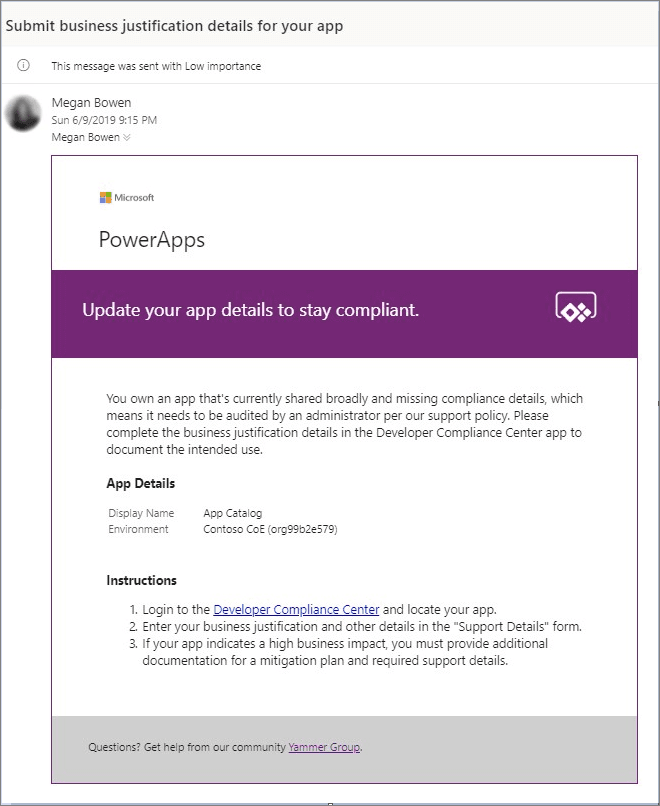
Welcome email to new makers
Power Apps and Power Automate can be discovered virally within an organization's tenant through the Office 365 portal. Makers might be confused about whether they are allowed to use these tools or not.
Detecting when a maker has created their first app or flow and sending them some useful information to accelerate their journey will immediately imply that these tools are the ones that they are permitted to use. Now, they will have a list of resources that can ease their transition into using these tools.
Explanation
The Power Platform Centre of Excellence (COE) Starter Kit is a set of apps, flows, a custom connector, and a Power BI dashboard that allows organizations to govern their Power Platform environments. The tool is freely available for download on GitHub.
The Starter Kit is a great tool for organizations to increase the visibility of what their makers are doing in their tenant. Naturally, this tool immediately applies to two personas: Cyber Security analysts and Organizational Change Management (OCM) interests. Makers that are building applications and services that introduce risk to the organization should be monitored, but makers who are automating workloads within sanctioned systems and services should be empowered and encouraged to expand on their efforts.
The Starter Kit does have some prerequisites, including:
A global tenant admin, Power Platform Service admin, or Dynamics 365 service admin role is required to access the tenant resources.
A Power Apps premium license for accessing Microsoft Dataverse.
An environment with Dataverse because the Starter Kit solution will need to store metadata about the apps and flows that are detected within an environment.
Power BI Desktop to view the reports and visualizations that highlight the app and flow use within the tenant.
Within the Starter Kit, administrators will discover the tools and features that are discussed in the following sections.
DLP Strategy
By using the DLP Editor app, an administrator can explore existing DLP policies and evaluate the impact of moving a connector from one data group to another. If a change to a data group has an impact on an existing app, that will be highlighted in the Affected Power Apps list. Then, an administrator can send an email, through an in-app experience, to the owner of that application and warn them of the upcoming change.
This current, in-product DLP editor experience doesn't provide this type of what-if analysis, so we recommend that you use the DLP Strategy app that comes with the COE Starter Kit when making DLP changes. Using the DLP Strategy app will also help you understand the impact on existing apps when DLP changes are made and help you reduce the chance of unknowingly breaking someone's app.
Catalogue tenant resources, visualize data in Power BI
While Admin Analytics, which is found in the Power Platform Admin centre, provides some insight into the use of Power Apps and Power Automate, it does so within the context of an environment. This parameter makes developing a holistic picture of usage difficult. However, using the tools that are provided in the COE Starter Kit brings all these insights together by using Dataverse, a model-driven Power App, and a Power BI dashboard. These assets, plus the inclusion of flows that will sync data from Office 365 Security and Compliance logs and through the Power Platform management connectors into Dataverse entities, provide the greatest level of visibility for administrators.
The Power BI dashboard connects to Starter Kit Dataverse entities and contains tabs that provide the following reports:
Overview - Includes the total number of apps and flows that have been created, including a breakdown based on the maker's location and the number of apps/flows that they have created.
Environments - Highlights the number of environments that have been created and includes the type of environment (Default, Production, Sandbox, Trial), and then identifies the creators of the environments and when the environment was created.
Apps - Provides insights into the usage of apps, including the number of sessions and users that the app has been shared with. This report also breaks down usage by the department by pivoting data based on the department that has been specified inside of a user's Office 365 profile.
App detail - Examines the specifics of the app, including the connection type and when the app was last published.
Flows - Displays a flow creation trend that will break down when flows were created. This report will also pivot data based on the user's department and includes a breakdown of the flows that were created by the environment.
Custom Connectors - Lists all the custom connectors that exist within a tenant. This report also lists the users that created the connectors and then trends the month that they were created in.
Makers - Identifies all the makers within the environment and identifies how many apps and flows they have built. A slicer exists that allows a consumer of this report to filter based on the maker's department.
Connections - Displays the number of connections that have been established, by the connector. This report provides great insight into the popularity of specific connectors within your tenant.
App Audit
The main purpose of the Sample App Audit process is to demonstrate how an admin could identify overshared or often used resources and gather further information, like business justification and business impact of an outage, for those apps. Having a platform that provides democratized access to technology is only useful if people don't create many redundant or low-value applications. Situations might also occur where people create temporary applications for proof-of-concept purposes. These apps can clutter an environment if they are not cleaned up. Within the COE Starter Kit, app makers can be prompted to attest their application to ensure that it addresses business justification requirements. If the application doesn't address these requirements, makers can have their application removed from the environment.
App catalogue
The App catalogue application acts as a catalogue that helps with the discoverability of apps. Users can explore featured apps and browse apps by category. The app catalogue can be a great entry point to launch apps for end users and makers can explore to see if an application already exists before they create another app that provides similar functionality. An Admin decides which apps are featured in the App catalogue by completing the App Audit process. After an app has been approved by the App Audit process, these apps can be featured in the app catalogue.
Set Owner
Administrating access to applications can be done by the Owner of the application. However, circumstances might occur where you want an administrator to provide access. By using the Set Owner app, you can allow for this situation by selecting an app, adding users, and then indicating whether they should be able to view the app or edit the app.
Welcome email to new makers
Power Apps and Power Automate can be discovered virally within an organization's tenant through the Office 365 portal. Makers might be confused about whether they are allowed to use these tools or not.
Detecting when a maker has created their first app or flow and sending them some useful information to accelerate their journey will immediately imply that these tools are the ones that they are permitted to use. Now, they will have a list of resources that can ease their transition into using these tools.
Question 17 Single Choice
DLP data groups can be used to separate connectors that share similar characteristics when it comes to their applicability to the business. Custom connectors are placed in the default data group automatically.
Which of the following is a valid challenge administrators have with custom connectors?
Explanation
Click "Show Answer" to see the explanation here
DLP Business and Non-business data groups can be used to separate connectors that share similar characteristics when it comes to their applicability to the business. For flows and apps that are processing business-related data, you will want to ensure that these connectors are placed within the Business data group. When you have connectors that don't support valid business use cases, these connectors are best placed in the Non-business data group.
When a DLP policy is created, Microsoft will designate a default data group, which will be assigned automatically to the Non-business data group.
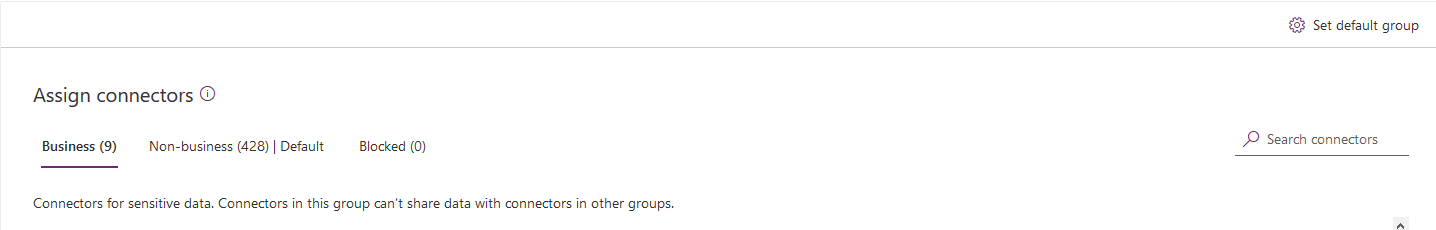
An administrator can change the default data group by selecting the Set default group button and choosing the data group that they want to designate as the default data group.
Changing the default data group does have implications; therefore, administrators should understand the impact that their action will have. Whenever a new connector is made available for Power Automate (and Power Apps), it will automatically reside within the default data group. These new connectors can come from a variety of sources, including Microsoft, third-party connector providers, and custom connectors from inside your organization.
When a new Microsoft or third-party connector is published, it is automatically available for use by makers within the environment that the connector was deployed. Administrators need to be mindful of this behaviour because it has an impact on DLP policies. For example, assume an organization has encouraged users to build flows that take advantage of Office 365 connectors. In addition, administrators have tried to prevent makers from sending business data from Office 365 systems to consumer-based services like email and file sharing.
As a result of this strategy, consumer-based connectors have been placed into the Non-business data group, which is also the default data group. Suppose Microsoft introduces a new Office 365 connector that will be placed into the default data group as a result, which means that a maker can build a flow that includes data from this new Office 365 service and send that data to a consumer-based email or file sharing service.
Administrators need to understand the behaviour of the default data group to avoid undesirable data leakage. Administrators can be made aware of new connectors that have been recently published by provisioning a flow template that detects when new connectors have been published. A later module of this learning path will discuss this template and others.
Custom connectors also pose a challenge for administrators. Much like Microsoft and third-party connectors, custom connectors will also be placed in the default data group. However, they will not be visible, which can create challenges.
The good news is that, by using PowerShell or Power Platform Management connectors, an administrator can add custom connectors to a data group. After a connector has been added, it can be managed through the Power Automate Admin Centre.
Explanation
DLP Business and Non-business data groups can be used to separate connectors that share similar characteristics when it comes to their applicability to the business. For flows and apps that are processing business-related data, you will want to ensure that these connectors are placed within the Business data group. When you have connectors that don't support valid business use cases, these connectors are best placed in the Non-business data group.
When a DLP policy is created, Microsoft will designate a default data group, which will be assigned automatically to the Non-business data group.
An administrator can change the default data group by selecting the Set default group button and choosing the data group that they want to designate as the default data group.
Changing the default data group does have implications; therefore, administrators should understand the impact that their action will have. Whenever a new connector is made available for Power Automate (and Power Apps), it will automatically reside within the default data group. These new connectors can come from a variety of sources, including Microsoft, third-party connector providers, and custom connectors from inside your organization.
When a new Microsoft or third-party connector is published, it is automatically available for use by makers within the environment that the connector was deployed. Administrators need to be mindful of this behaviour because it has an impact on DLP policies. For example, assume an organization has encouraged users to build flows that take advantage of Office 365 connectors. In addition, administrators have tried to prevent makers from sending business data from Office 365 systems to consumer-based services like email and file sharing.
As a result of this strategy, consumer-based connectors have been placed into the Non-business data group, which is also the default data group. Suppose Microsoft introduces a new Office 365 connector that will be placed into the default data group as a result, which means that a maker can build a flow that includes data from this new Office 365 service and send that data to a consumer-based email or file sharing service.
Administrators need to understand the behaviour of the default data group to avoid undesirable data leakage. Administrators can be made aware of new connectors that have been recently published by provisioning a flow template that detects when new connectors have been published. A later module of this learning path will discuss this template and others.
Custom connectors also pose a challenge for administrators. Much like Microsoft and third-party connectors, custom connectors will also be placed in the default data group. However, they will not be visible, which can create challenges.
The good news is that, by using PowerShell or Power Platform Management connectors, an administrator can add custom connectors to a data group. After a connector has been added, it can be managed through the Power Automate Admin Centre.
Question 18 Single Choice
Scenario: You are working at OZcorp which is a multi-million dollar company run by Mayor Norman Osborn. Profits from the company are used to fund Norman’s operatives, such as a police task force.
At the moment, you have been hired by OZcorp as a Microsoft Power Apps SME. Currently, the IT team is working with Power BI for the first time. You are demonstrating to the group how to use the program by showing its most common purpose. Which of the following is Power BI’s main purpose?
Explanation
Click "Show Answer" to see the explanation here
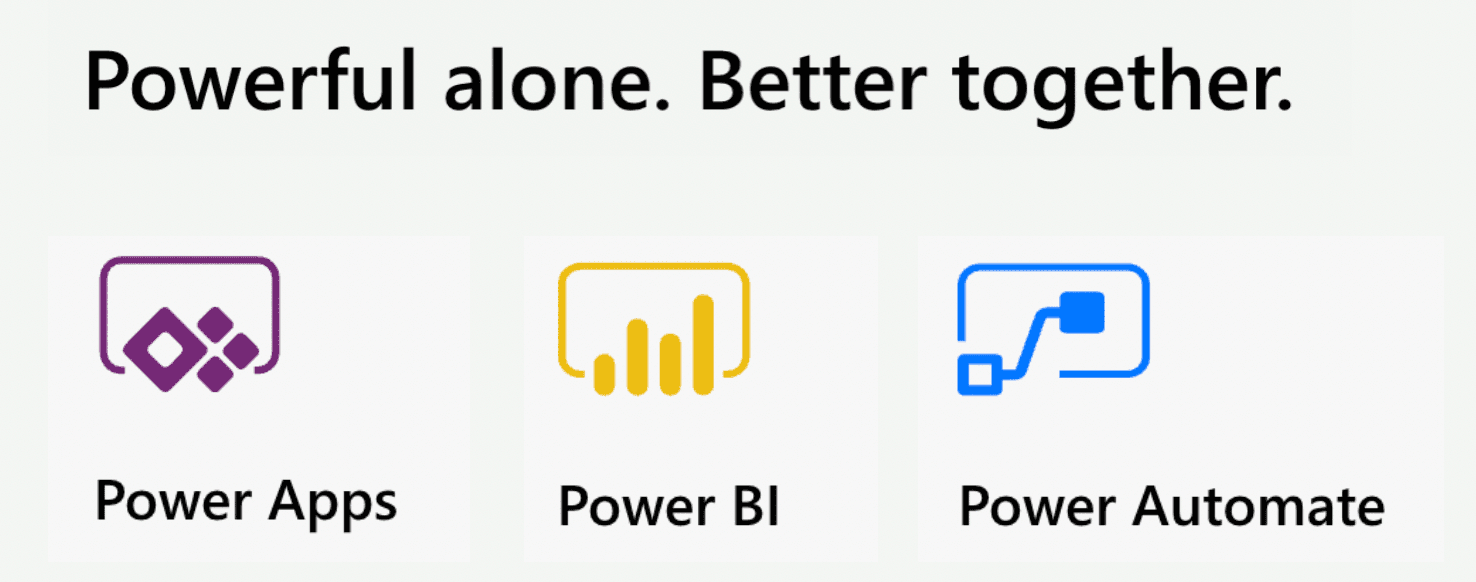
Microsoft Power Apps works with other technologies to help you build powerful apps for your organization, including:
Power Automate - This allows you to build automated workflows to receive notifications, run processes, collect data, and more.
Power BI - This allows you to connect data from multiple sources and transform the data into graphical visualizations to gain insights.
Related Power Platform technologies
As you continue developing your application, you may want to consider implementing other Power Apps-related technologies such as Power Automate and or Power BI. For example, you may have a simple Expense Report App that requires approval before an item can be purchased. With Power Automate, you can create a Flow to make this happen. Or maybe you want to display your data with custom charts and graphs giving your users a more visual look into the data, which can often be useful.
Power Automate
Power Automate brings automation to your business. This can be traditional workflows via flow, Robotic Process Automation (RPA) for automating legacy systems via desktop flow, or business process automation via Business Process Flows. Each of these capabilities increases your productivity to connect disjointed systems to build the business solution you need and make your app more powerful.
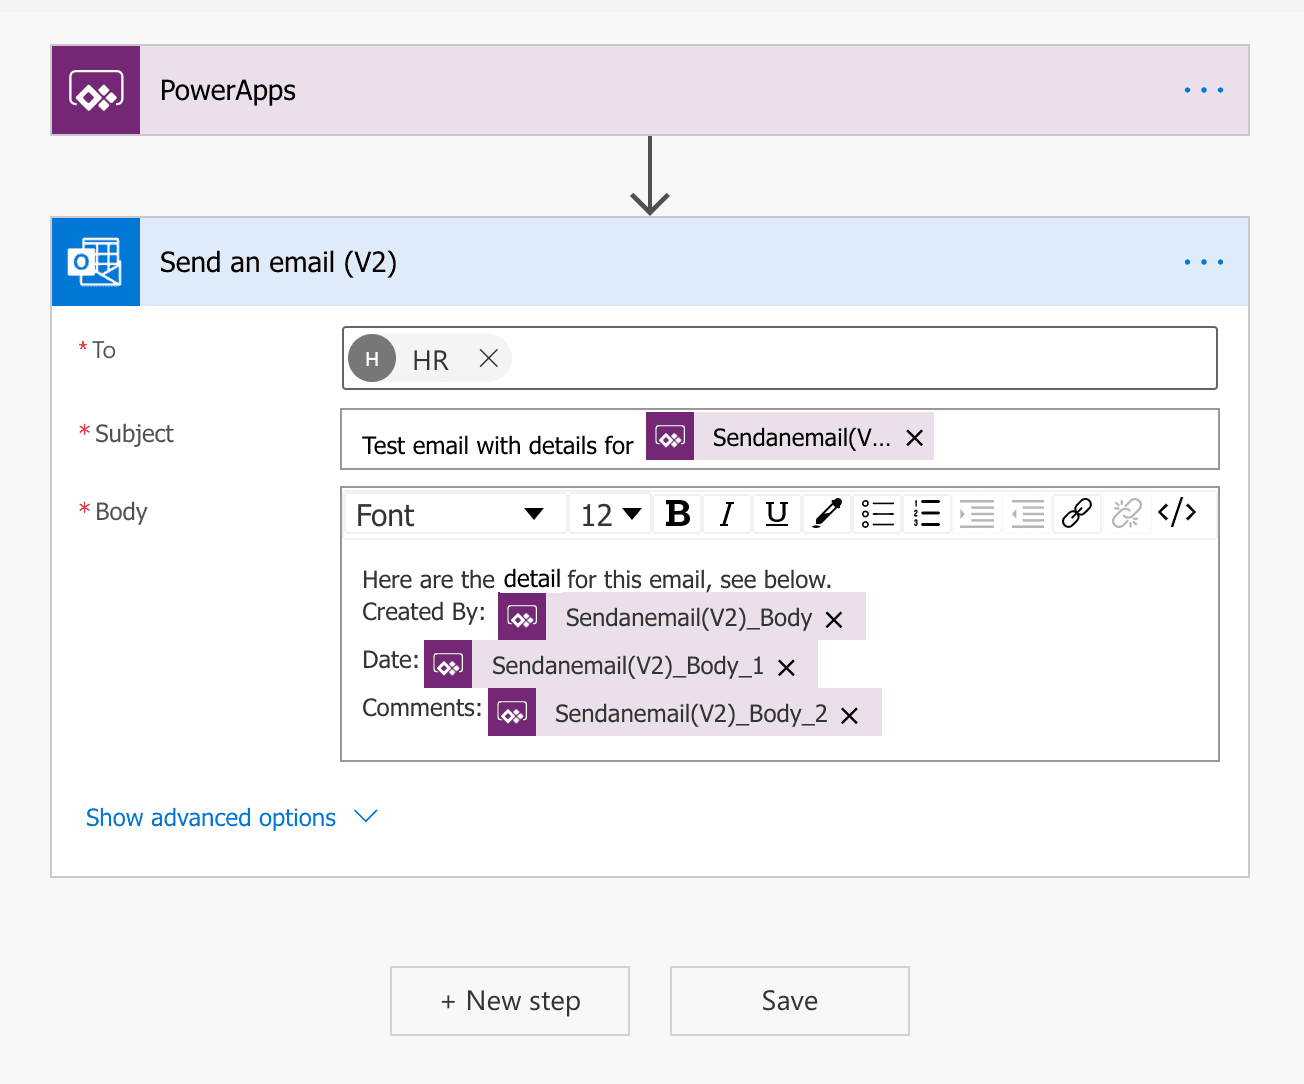
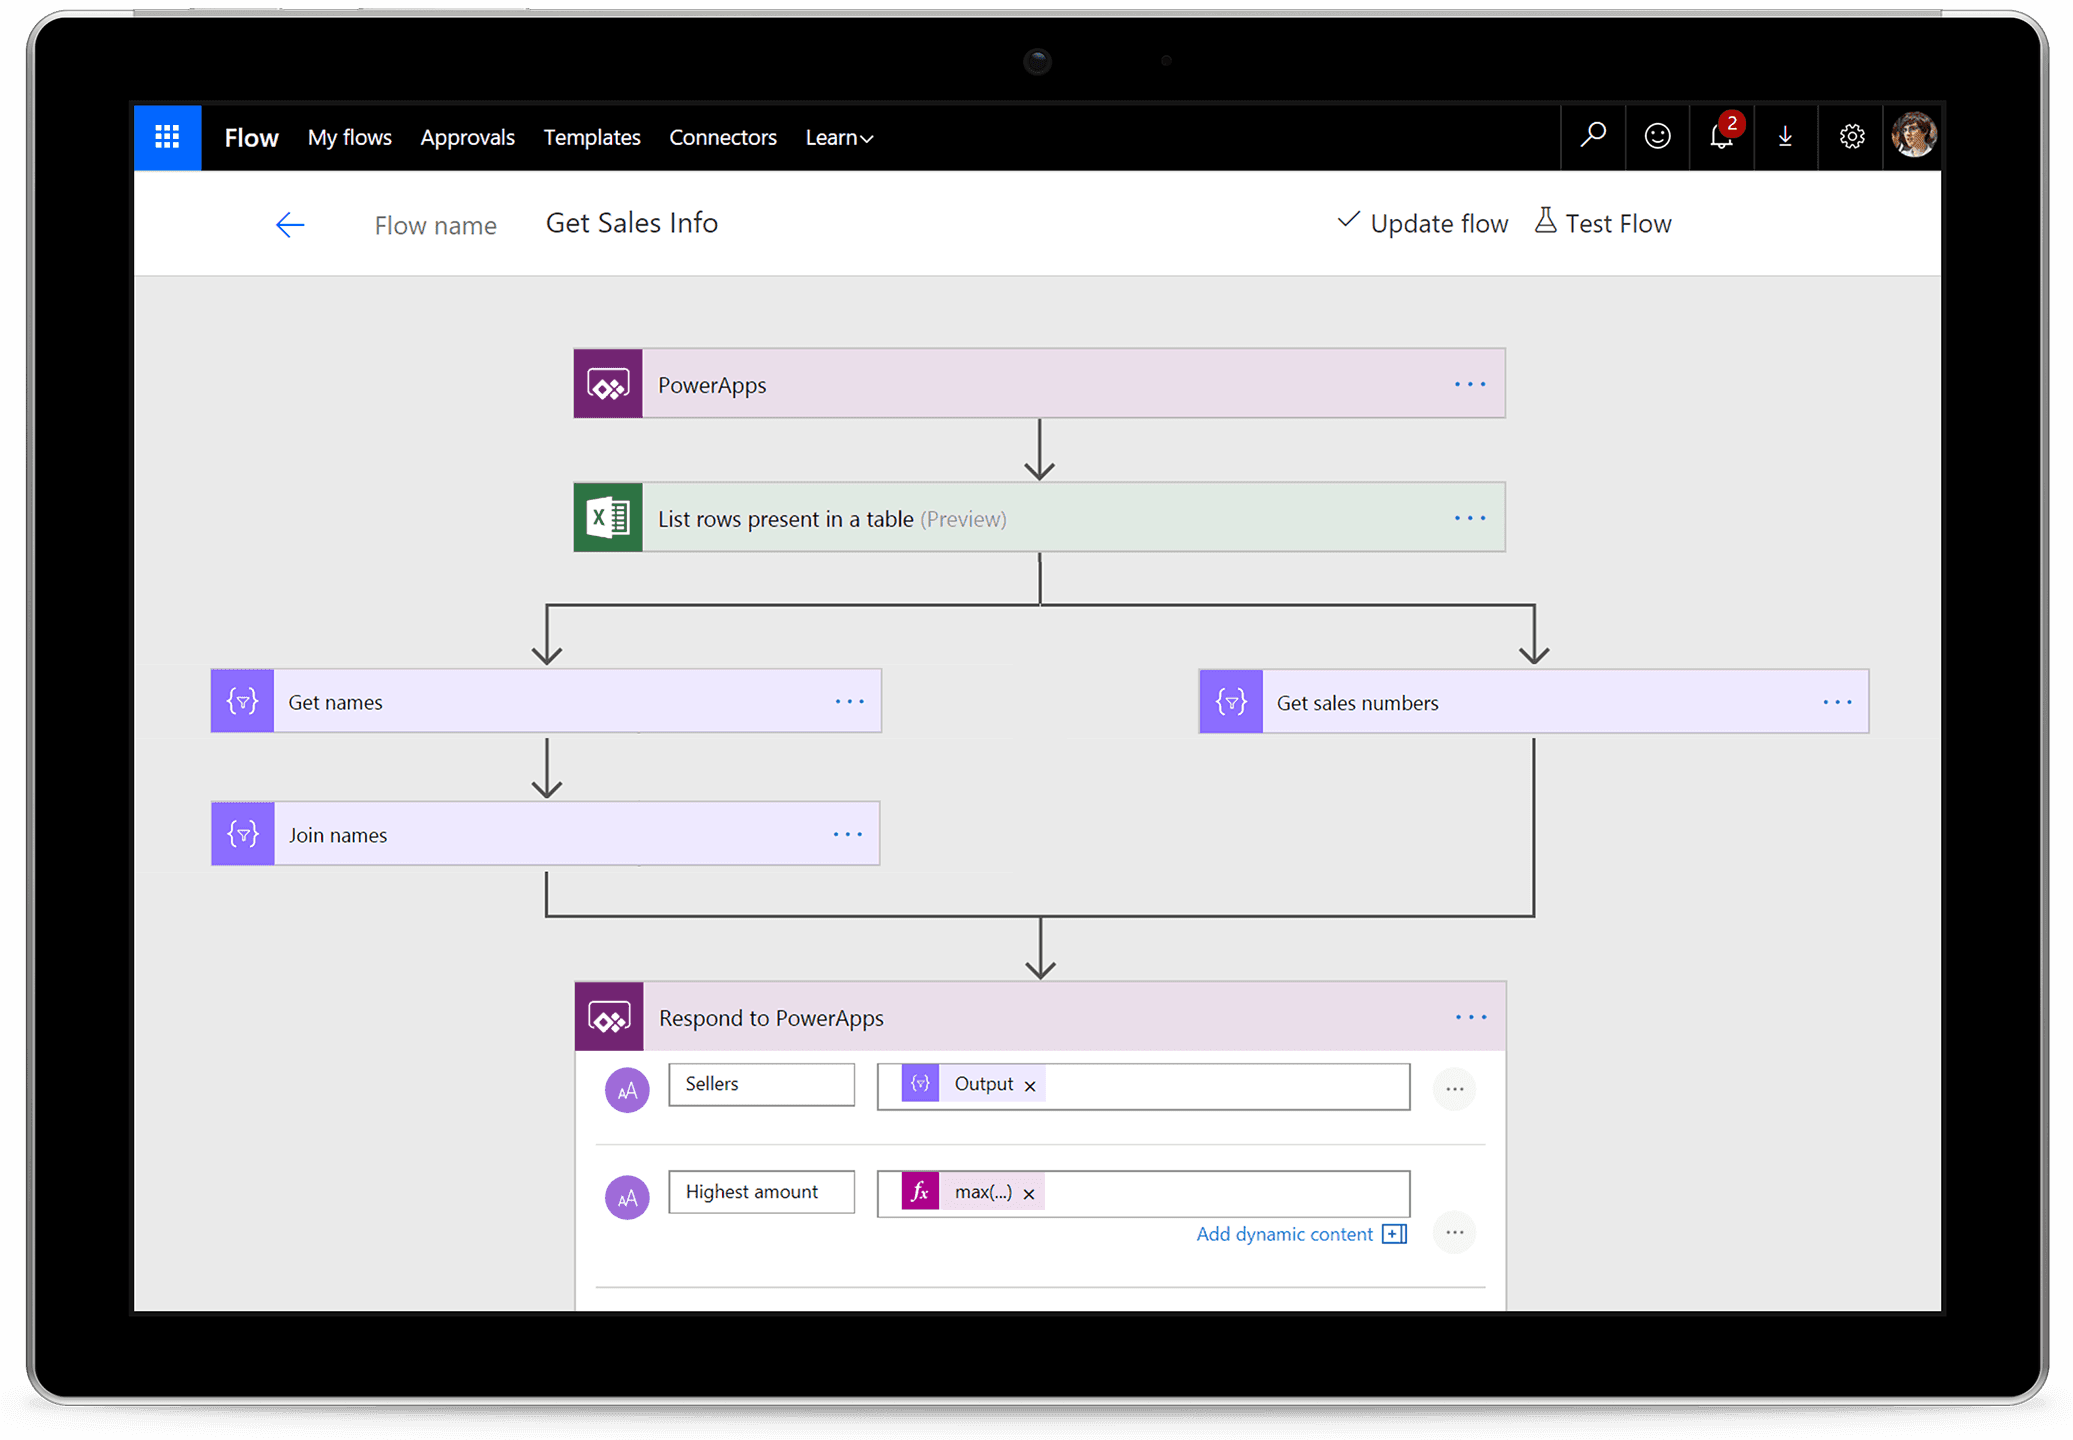
You can use Power Automate to create logic that performs one or more tasks when an event occurs in a canvas app. For example, configure a button to execute a flow to do one of the following: create an item in a SharePoint list, send an email or meeting request, or add a file to OneDrive. The button could be configured to do all of those in a single Power Automate flow. You can configure any control in the app to start the flow, which continues to run even if you close Power Apps. Below is an example using Power Automate to send a flow:
Identify flows in your solution
How do you determine if the solution you’re building requires a Flow? There are many simple functions Power Apps can do, like sending an email when a button is pressed in your application. This email generated from Power Apps can also contain dynamic/specific information and be sent to any email address you would like. Often, customers will use Power Automate to create this same functionality even though Power Apps can do this out of the box. Power Automate should be used for more complex solutions, such as the approval workflows. With Power Automate you can run an approval when a button is pressed, on a schedule, when an item is created or modified, and so on.
For many Power Apps solutions, Power Automate is used to handle complex business logic. Do you need a way to make sure someone acted on the incident report that was generated by your app? Or, do you need a process to kick off every time new data is created in another system so Power Apps will have the data it needs? Do you need to check each morning to see if an inspection is due that day and then send an email with a link to your Power Apps inspection form? These are great uses of Power Automate to transform your app from a point solution to a fully-featured business solution.
Power BI
Power BI is an analytics tool within the Power Platform suite. Power BI connects data from multiple sources and transforms the data into graphical visualizations to gain insights. It allows business users to utilize many different visualizations to build comprehensive reports and dashboards. When creating Power BI reports to view and analyze your app data, you have the ability to customize them for personal use and will only be accessible by you, providing you with a more unique and custom experience. If you need to share the report with others, you and each of the report consumers will need a Power BI Pro license. This license allows you to not only share the content but also control what others are able to do with the shared report or dashboard.
While Power Apps has capabilities to include simple graphs or tables, many solutions would be better served with a visualization provided by Power BI. Power Apps and Power BI have two options for seamless integration:
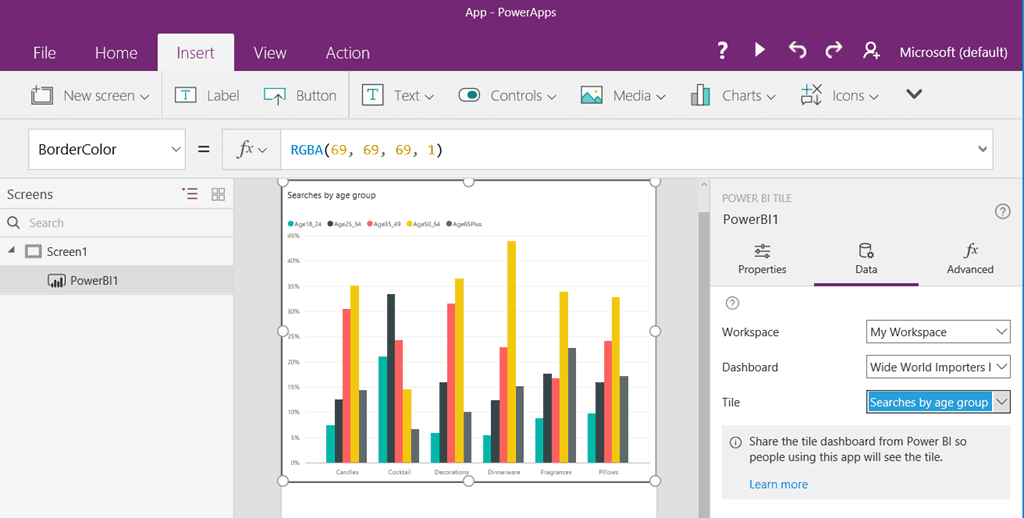
Embed a Power BI tile in a Power Apps app
By embedding a Power BI tile in a Power Apps solution, you are able to bring valuable visualizations into the app to allow the user to consume that data within the context of the app.
Embed a Power Apps app in a Power BI dashboard
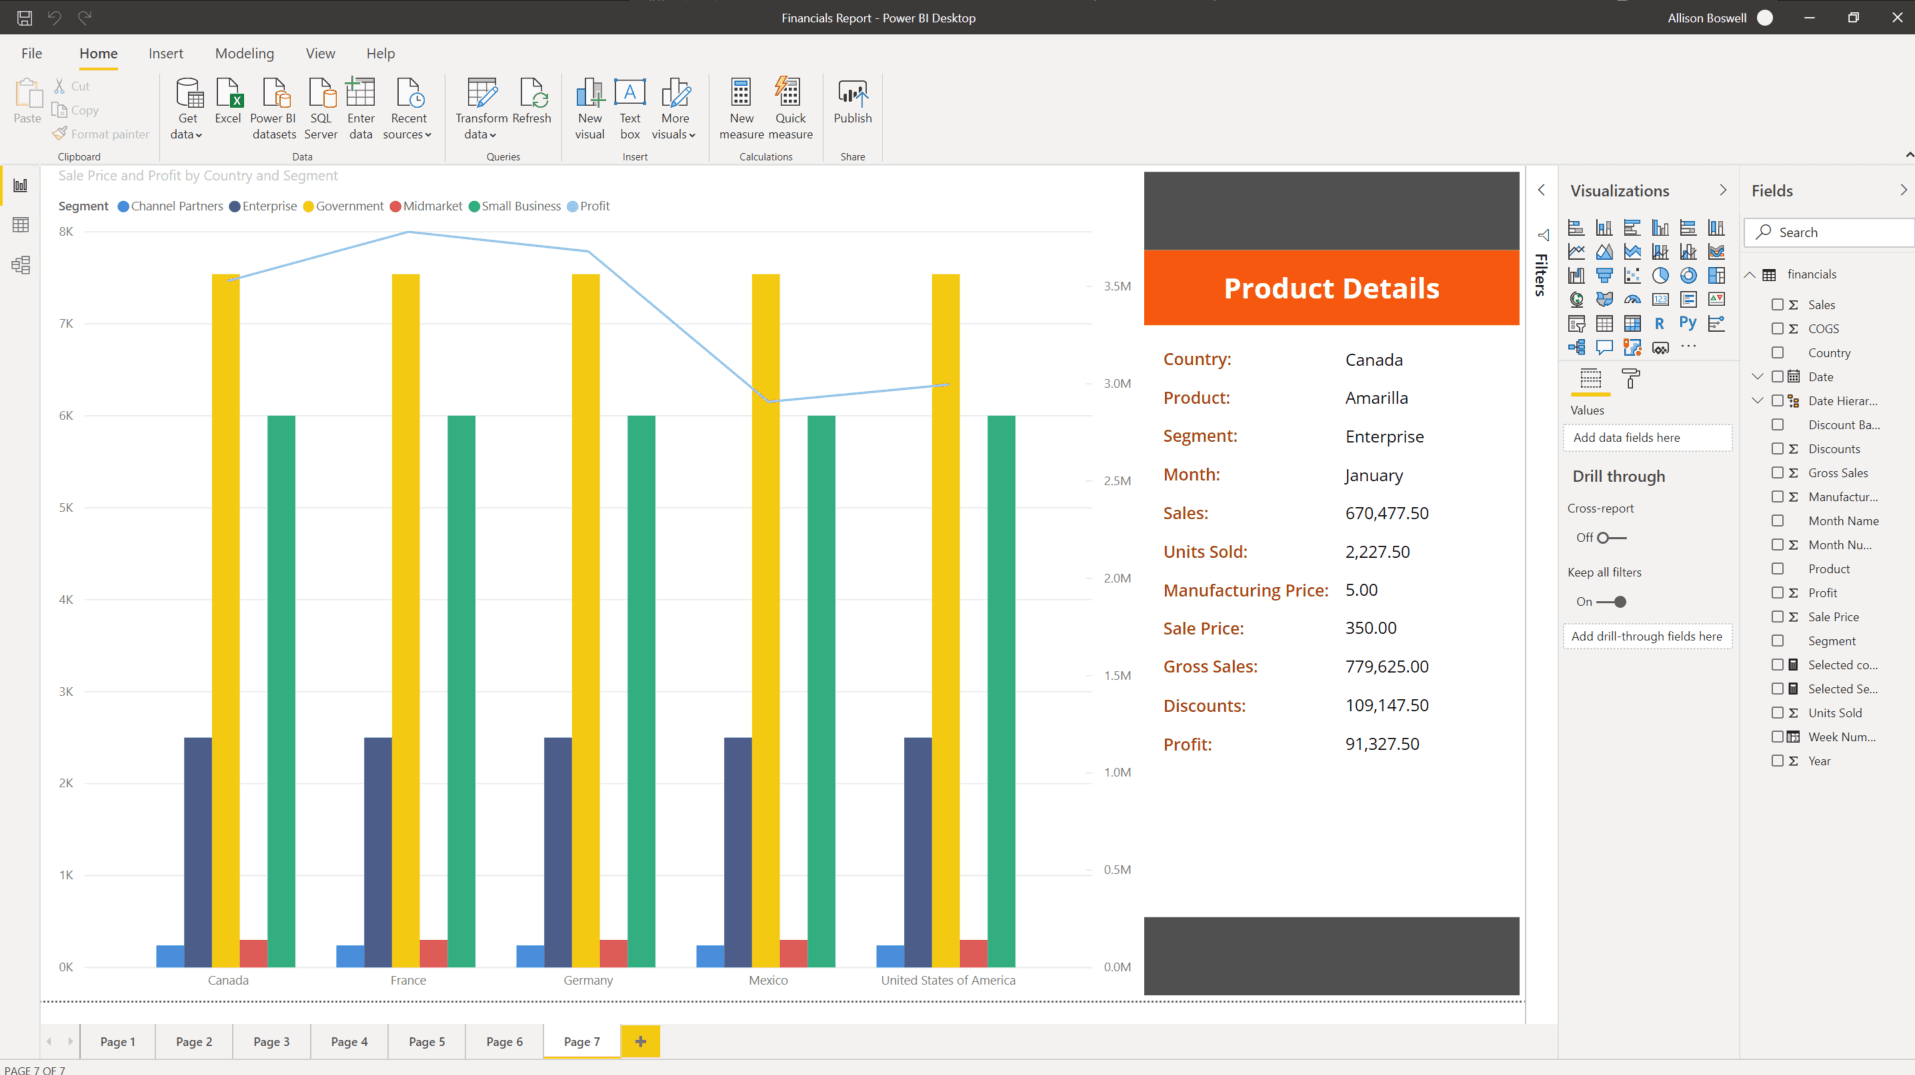
Another integration between these two applications is to embed a Power Apps app in your Power BI report. This allows the user to act on data while never leaving the dashboard resulting in a better user experience. Consider an inventory management dashboard for a manufacturing facility. Without leaving the dashboard, the user can submit to purchasing an order for other material. While the solution may have been utilizing both the Power Apps and Power BI platforms, the user simply experiences a complete end-to-end solution in one window on their desktop.
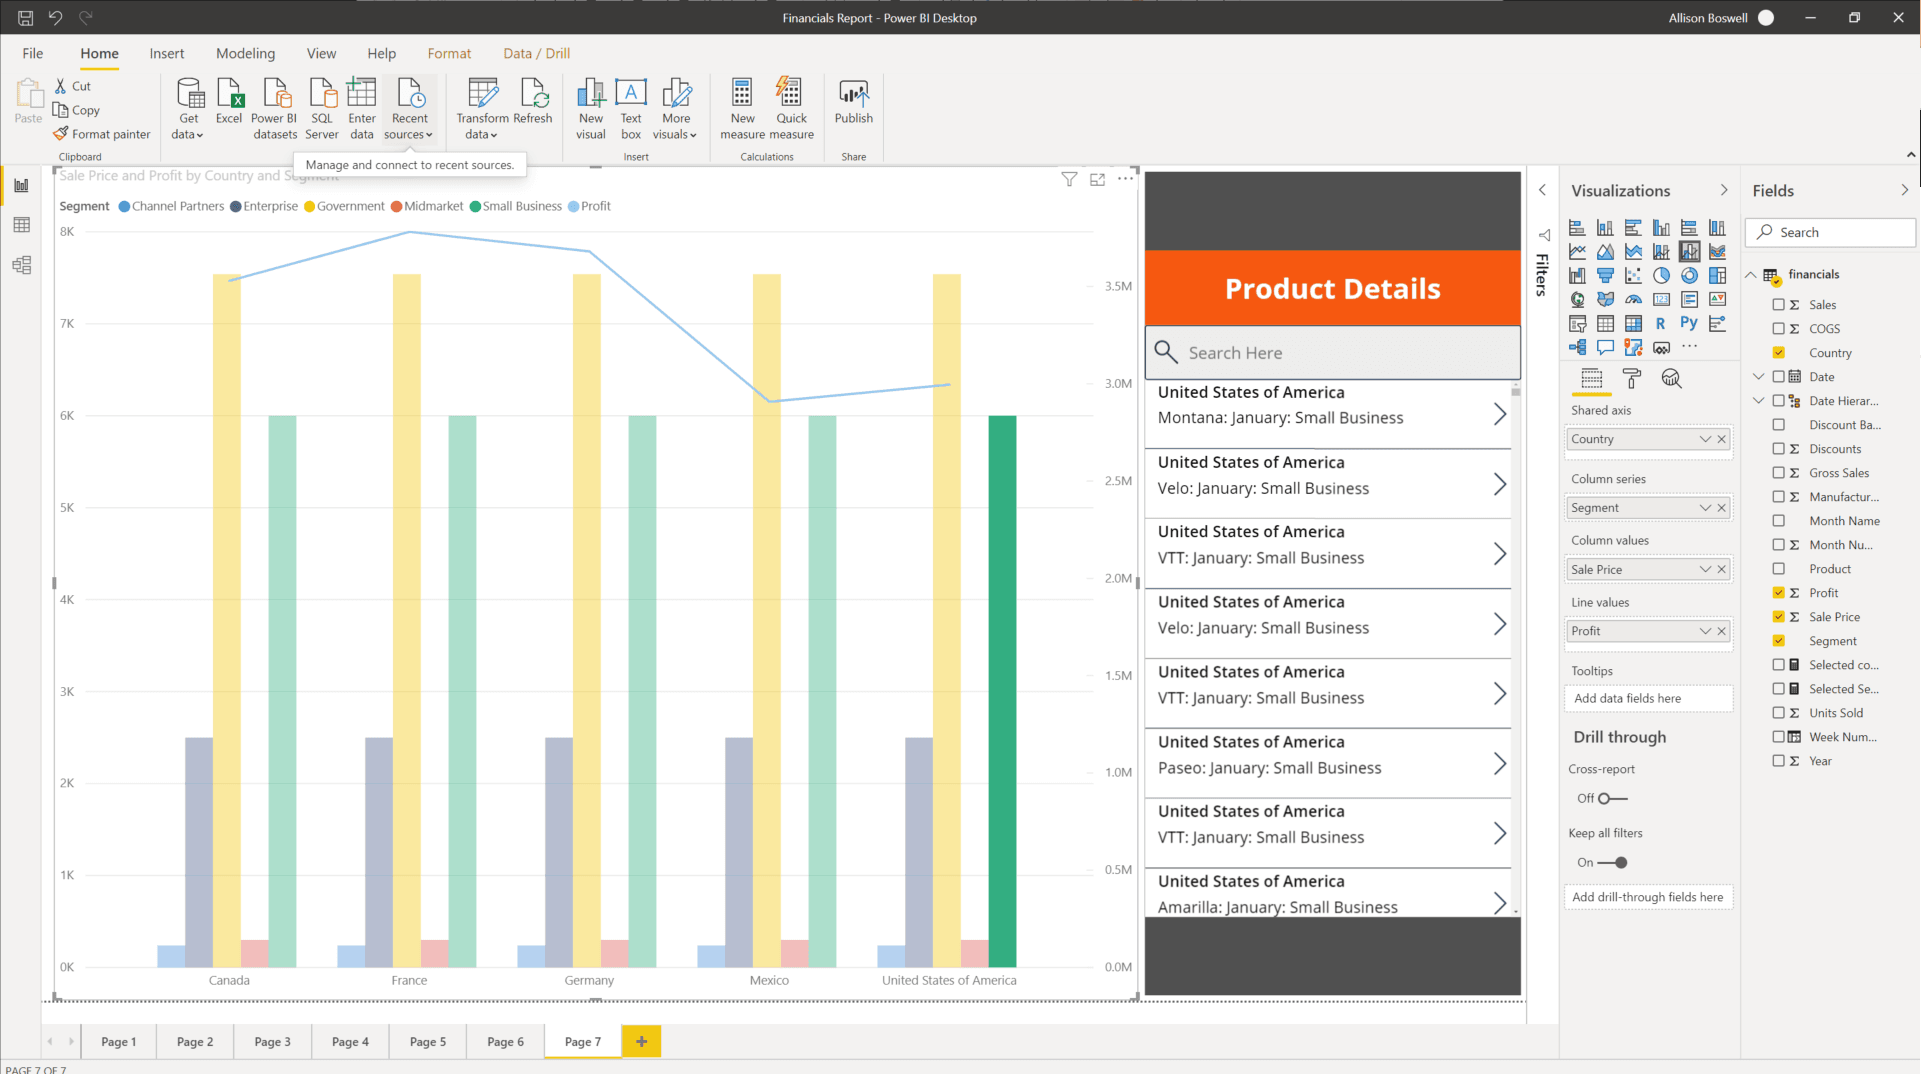
In the example below, we are analyzing the Sale Price and Profit by Country and Segment. Notice once you have embedded your Power App in a Power BI Dashboard you can navigate between screens.
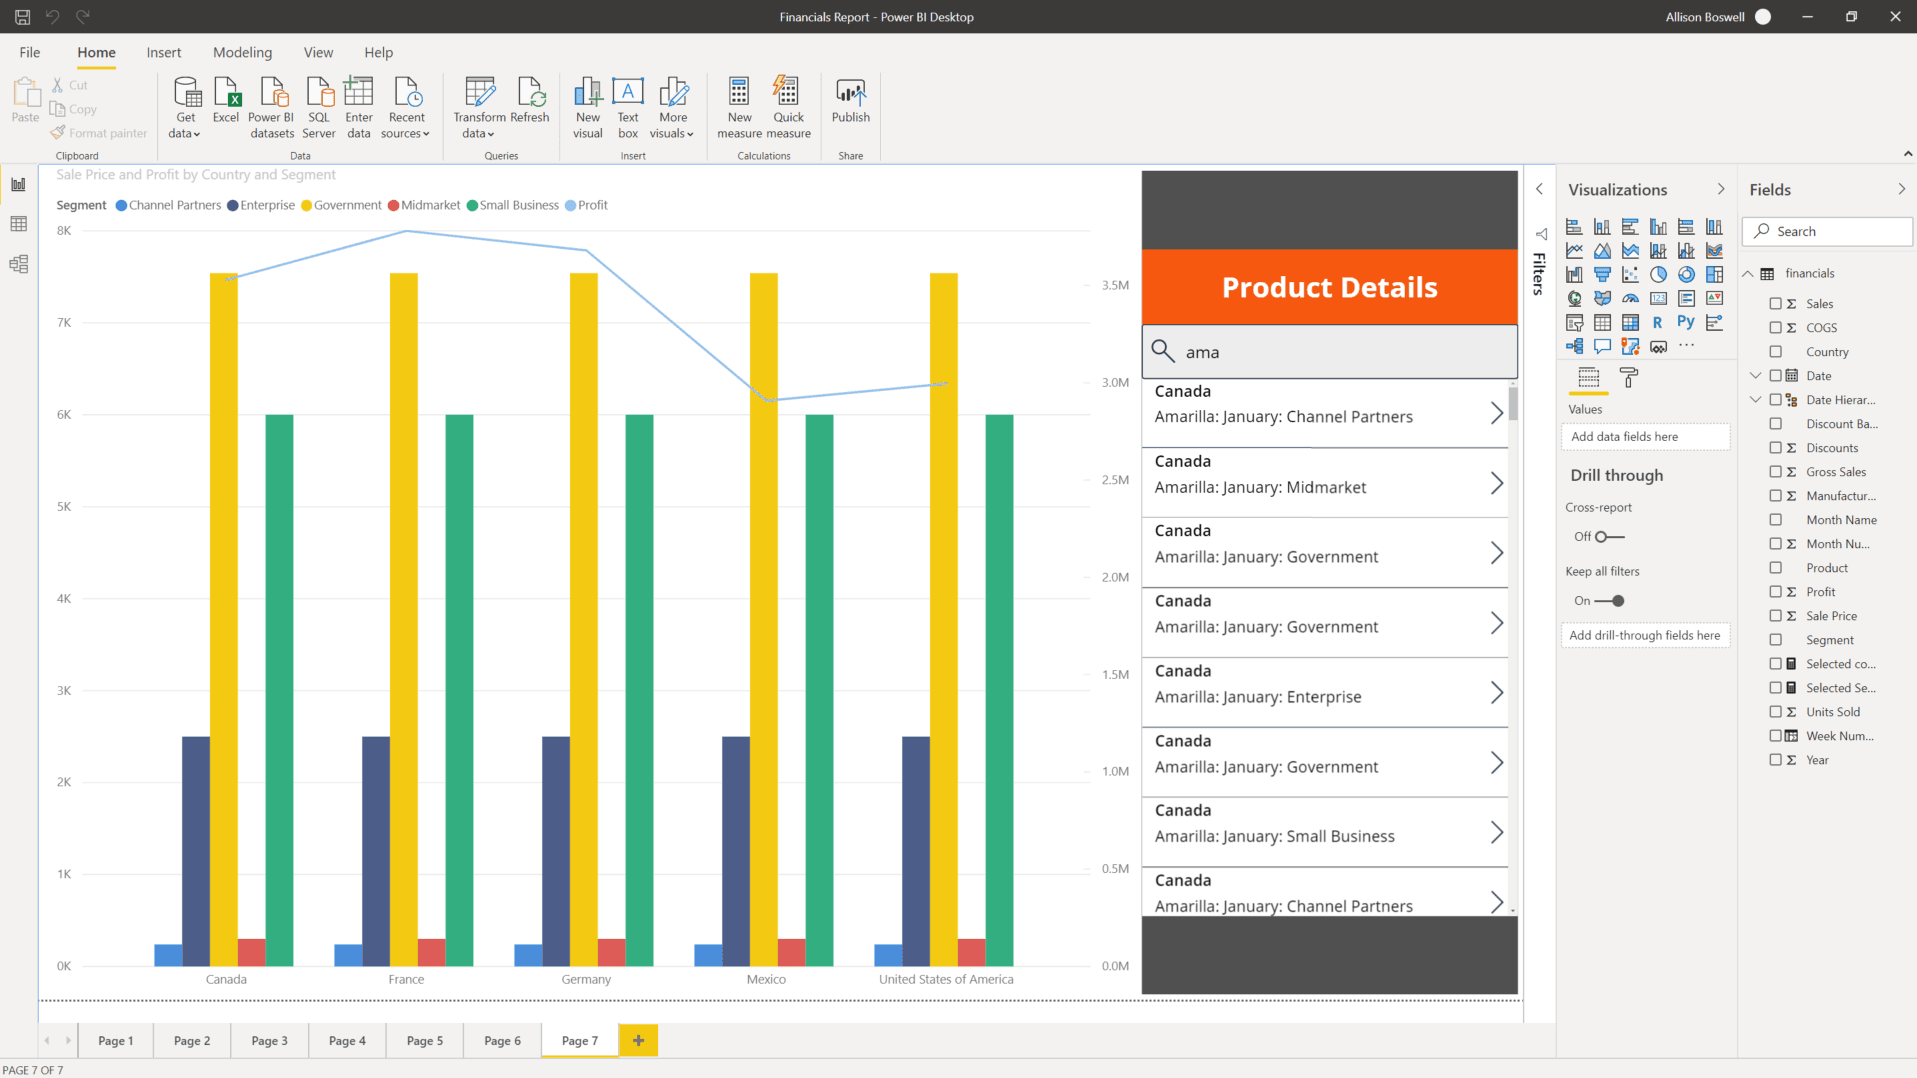
In this next screenshot, still working with the same data as the previous example, you can utilize the native Power Apps features like Search with Power BI data.
In this last screenshot, for this example, you will see the embedded Power App is filtered by the Power BI selection.
Translating needs to the appropriate technology
To build the best solution, think through the use cases and determine how you want to collect the data, use the data, and analyze the data. Once you have determined how the solution will be used in each one of those cases, you can begin to select the right technology to execute each function.
It would be difficult to cover every use case and decision point, but the number of steps in your solution/process will aid you in determining which technology best suits your needs. Power Apps is great for performing simple solutions with minimal steps but as your solutions become more complex and requires multiple steps, Power Automate would be the better solution.
When deciding whether to use the basic charts, graphs, and visuals that come with Power Apps out of the box or to utilize a more powerful software like Power BI it really depends on your business solution and requirements. For example, if in your solution, you are wanting to add some basic graphs and charts to improve the app's overall look and feel while adding some visual flair for your users, Power Apps has you covered.
On the other hand, if your solution requires an in-depth analysis of your data and robust visuals, Power BI will be the best product for your solution. Keep in mind, with Power BI, each app user will need another license on top of the Power Apps license. This is a small price to pay though if our solution relies on intuitive dashboards, charts, graphs, and several other features to help you get the most out of your solution.
By identifying the needs of related Power Apps technologies in your solution and strategically implementing them, you will be able to provide your users with a better overall experience when using the solution.
Explanation
Microsoft Power Apps works with other technologies to help you build powerful apps for your organization, including:
Power Automate - This allows you to build automated workflows to receive notifications, run processes, collect data, and more.
Power BI - This allows you to connect data from multiple sources and transform the data into graphical visualizations to gain insights.
Related Power Platform technologies
As you continue developing your application, you may want to consider implementing other Power Apps-related technologies such as Power Automate and or Power BI. For example, you may have a simple Expense Report App that requires approval before an item can be purchased. With Power Automate, you can create a Flow to make this happen. Or maybe you want to display your data with custom charts and graphs giving your users a more visual look into the data, which can often be useful.
Power Automate
Power Automate brings automation to your business. This can be traditional workflows via flow, Robotic Process Automation (RPA) for automating legacy systems via desktop flow, or business process automation via Business Process Flows. Each of these capabilities increases your productivity to connect disjointed systems to build the business solution you need and make your app more powerful.
You can use Power Automate to create logic that performs one or more tasks when an event occurs in a canvas app. For example, configure a button to execute a flow to do one of the following: create an item in a SharePoint list, send an email or meeting request, or add a file to OneDrive. The button could be configured to do all of those in a single Power Automate flow. You can configure any control in the app to start the flow, which continues to run even if you close Power Apps. Below is an example using Power Automate to send a flow:
Identify flows in your solution
How do you determine if the solution you’re building requires a Flow? There are many simple functions Power Apps can do, like sending an email when a button is pressed in your application. This email generated from Power Apps can also contain dynamic/specific information and be sent to any email address you would like. Often, customers will use Power Automate to create this same functionality even though Power Apps can do this out of the box. Power Automate should be used for more complex solutions, such as the approval workflows. With Power Automate you can run an approval when a button is pressed, on a schedule, when an item is created or modified, and so on.
For many Power Apps solutions, Power Automate is used to handle complex business logic. Do you need a way to make sure someone acted on the incident report that was generated by your app? Or, do you need a process to kick off every time new data is created in another system so Power Apps will have the data it needs? Do you need to check each morning to see if an inspection is due that day and then send an email with a link to your Power Apps inspection form? These are great uses of Power Automate to transform your app from a point solution to a fully-featured business solution.
Power BI
Power BI is an analytics tool within the Power Platform suite. Power BI connects data from multiple sources and transforms the data into graphical visualizations to gain insights. It allows business users to utilize many different visualizations to build comprehensive reports and dashboards. When creating Power BI reports to view and analyze your app data, you have the ability to customize them for personal use and will only be accessible by you, providing you with a more unique and custom experience. If you need to share the report with others, you and each of the report consumers will need a Power BI Pro license. This license allows you to not only share the content but also control what others are able to do with the shared report or dashboard.
While Power Apps has capabilities to include simple graphs or tables, many solutions would be better served with a visualization provided by Power BI. Power Apps and Power BI have two options for seamless integration:
Embed a Power BI tile in a Power Apps app
By embedding a Power BI tile in a Power Apps solution, you are able to bring valuable visualizations into the app to allow the user to consume that data within the context of the app.
Embed a Power Apps app in a Power BI dashboard
Another integration between these two applications is to embed a Power Apps app in your Power BI report. This allows the user to act on data while never leaving the dashboard resulting in a better user experience. Consider an inventory management dashboard for a manufacturing facility. Without leaving the dashboard, the user can submit to purchasing an order for other material. While the solution may have been utilizing both the Power Apps and Power BI platforms, the user simply experiences a complete end-to-end solution in one window on their desktop.
In the example below, we are analyzing the Sale Price and Profit by Country and Segment. Notice once you have embedded your Power App in a Power BI Dashboard you can navigate between screens.
In this next screenshot, still working with the same data as the previous example, you can utilize the native Power Apps features like Search with Power BI data.
In this last screenshot, for this example, you will see the embedded Power App is filtered by the Power BI selection.
Translating needs to the appropriate technology
To build the best solution, think through the use cases and determine how you want to collect the data, use the data, and analyze the data. Once you have determined how the solution will be used in each one of those cases, you can begin to select the right technology to execute each function.
It would be difficult to cover every use case and decision point, but the number of steps in your solution/process will aid you in determining which technology best suits your needs. Power Apps is great for performing simple solutions with minimal steps but as your solutions become more complex and requires multiple steps, Power Automate would be the better solution.
When deciding whether to use the basic charts, graphs, and visuals that come with Power Apps out of the box or to utilize a more powerful software like Power BI it really depends on your business solution and requirements. For example, if in your solution, you are wanting to add some basic graphs and charts to improve the app's overall look and feel while adding some visual flair for your users, Power Apps has you covered.
On the other hand, if your solution requires an in-depth analysis of your data and robust visuals, Power BI will be the best product for your solution. Keep in mind, with Power BI, each app user will need another license on top of the Power Apps license. This is a small price to pay though if our solution relies on intuitive dashboards, charts, graphs, and several other features to help you get the most out of your solution.
By identifying the needs of related Power Apps technologies in your solution and strategically implementing them, you will be able to provide your users with a better overall experience when using the solution.
Question 19 Single Choice
Scenario: O'Shaughnessy's is a fast-food restaurant. The chain has stores nationwide and is rivalled by Big Belly Burgers. You have been hired by the company to advise on working with Microsoft Dataverse.
At the moment, you are leading a meeting where the topic at hand is model-driven applications; the app is required to serve as a template to view information about a related entity record within a form for another entity record. The app should not require navigation to a different record to see the information needed to do work. These controls are associated with a lookup field that is included in a form.
Which type of form should be used?
Explanation
Click "Show Answer" to see the explanation here
Users of model-driven applications will encounter many forms in their user experience, and will even encounter different forms for the same entity depending on their role, job tasks and desired outcomes.
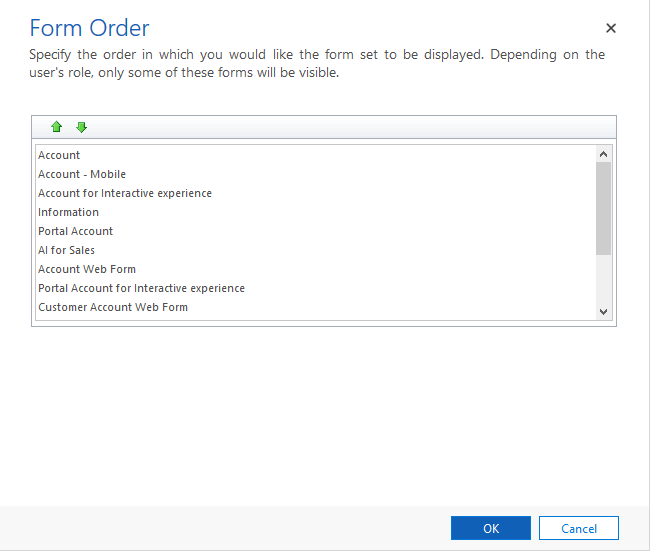
You can set form order when using multiple forms. This will define the order in which a user sees the available forms, within the allowed forms for their security roles.
Note: You can create more than one Quick Create form for a given entity, but only the first one in order will be available for end-users.
Access to forms
When users need to access common entities for different roles, it might be useful to have additional forms available to tailor the user experience for that particular set of users. You can assign a security role (or collection of security roles) to control access to the form. For example, you may have a set of users that are focused on sales and have had customizations to the Contact record such as the addition of LinkedIn Sales Navigator widgets. For a non-sales user, this would make for an extremely undesirable experience, with loads of unnecessary blank areas on the Contact form. You could simply copy the main contact record and then add or remove the components to the copy, and then assign security roles to each of the forms.
Note: Controlling user access to forms is not necessarily a secure means to prevent access to data. Sometimes users have other ways to interact with data such as advanced find or background automation.
Form types and behaviours
Main - Main forms are the primary user interface where people view and interact with their data. Main forms provide the widest range of options and are available for model-driven apps, the exception being Dynamics 365 for phones. One of the main design objectives for main forms is that you design them once and deploy them everywhere. The same main form you design for a model-driven app or the Dynamics 365 customer engagement apps web application, is also used in Dynamics 365 for Outlook and Dynamics 365 for tablets. The advantage of this approach is that you don’t have to integrate changes into multiple forms. Autosave is the default behaviour on main forms but can be disabled by administrators.
Quick create - With quick create forms, your app can have a streamlined data entry experience with full support for logic defined by form scripts and business rules. In Dynamics 365, quick create forms appear when you select the Create button in the navigation bar or when you choose + New when creating a new record from a lookup or sub-grid. Dynamics 365 customer engagement apps mobile use quick create forms for creating new records. If an entity already has a quick create form configured for it, the mobile apps use that form. If an entity doesn't have a configured quick create form, Dynamics 365 generates a quick create form for creating records in the mobile apps based on the main form definition.
Note: The entity definition must allow for Quick Create before you will be able to configure a Quick Create form. This setting is managed along with other Data Services for the entity.
Quick view - A quick view form can be added to another form as a quick view control. It provides a template to view information about a related entity record within a form for another entity record. This means your app users do not need to navigate to a different record to see the information needed to do their work. Quick view controls are associated with a lookup field that is included in a form. If the lookup field value is not set, the quick view control will not be visible. Data in quick view controls cannot be edited and quick view forms do not support form scripts.
Card - A card form is used in interactive dashboards and placed on forms of related entities. It is configured to show key fields at a glance in the entity feed. There are several options available to configure including colour coding based on criteria such as record status.
Miscellaneous form details
Each entity must have a designated fallback form. This is the form that all users would see if they do not have a security role assigned that matches your role tailored forms.
Only Main forms can be assigned to security roles.
When a user has access to multiple forms, a form selector will be available near the top of the form. If a user has access to only a single form for a given entity, there will be no form selector visible.
You can designate the main form as inactive. This will make it not visible to all users, regardless of security roles. This feature was included primarily to manage new forms included when organizations upgrade but you can use it to prevent people from being able to use any main form.
Explanation
Users of model-driven applications will encounter many forms in their user experience, and will even encounter different forms for the same entity depending on their role, job tasks and desired outcomes.
You can set form order when using multiple forms. This will define the order in which a user sees the available forms, within the allowed forms for their security roles.
Note: You can create more than one Quick Create form for a given entity, but only the first one in order will be available for end-users.
Access to forms
When users need to access common entities for different roles, it might be useful to have additional forms available to tailor the user experience for that particular set of users. You can assign a security role (or collection of security roles) to control access to the form. For example, you may have a set of users that are focused on sales and have had customizations to the Contact record such as the addition of LinkedIn Sales Navigator widgets. For a non-sales user, this would make for an extremely undesirable experience, with loads of unnecessary blank areas on the Contact form. You could simply copy the main contact record and then add or remove the components to the copy, and then assign security roles to each of the forms.
Note: Controlling user access to forms is not necessarily a secure means to prevent access to data. Sometimes users have other ways to interact with data such as advanced find or background automation.
Form types and behaviours
Main - Main forms are the primary user interface where people view and interact with their data. Main forms provide the widest range of options and are available for model-driven apps, the exception being Dynamics 365 for phones. One of the main design objectives for main forms is that you design them once and deploy them everywhere. The same main form you design for a model-driven app or the Dynamics 365 customer engagement apps web application, is also used in Dynamics 365 for Outlook and Dynamics 365 for tablets. The advantage of this approach is that you don’t have to integrate changes into multiple forms. Autosave is the default behaviour on main forms but can be disabled by administrators.
Quick create - With quick create forms, your app can have a streamlined data entry experience with full support for logic defined by form scripts and business rules. In Dynamics 365, quick create forms appear when you select the Create button in the navigation bar or when you choose + New when creating a new record from a lookup or sub-grid. Dynamics 365 customer engagement apps mobile use quick create forms for creating new records. If an entity already has a quick create form configured for it, the mobile apps use that form. If an entity doesn't have a configured quick create form, Dynamics 365 generates a quick create form for creating records in the mobile apps based on the main form definition.
Note: The entity definition must allow for Quick Create before you will be able to configure a Quick Create form. This setting is managed along with other Data Services for the entity.
Quick view - A quick view form can be added to another form as a quick view control. It provides a template to view information about a related entity record within a form for another entity record. This means your app users do not need to navigate to a different record to see the information needed to do their work. Quick view controls are associated with a lookup field that is included in a form. If the lookup field value is not set, the quick view control will not be visible. Data in quick view controls cannot be edited and quick view forms do not support form scripts.
Card - A card form is used in interactive dashboards and placed on forms of related entities. It is configured to show key fields at a glance in the entity feed. There are several options available to configure including colour coding based on criteria such as record status.
Miscellaneous form details
Each entity must have a designated fallback form. This is the form that all users would see if they do not have a security role assigned that matches your role tailored forms.
Only Main forms can be assigned to security roles.
When a user has access to multiple forms, a form selector will be available near the top of the form. If a user has access to only a single form for a given entity, there will be no form selector visible.
You can designate the main form as inactive. This will make it not visible to all users, regardless of security roles. This feature was included primarily to manage new forms included when organizations upgrade but you can use it to prevent people from being able to use any main form.
Question 20 Single Choice
Sometimes, your data might contain extra data or have data in the wrong format. Power BI Desktop includes the Power Query Editor tool, which can help you shape and transform data so that it's ready for your models and visualizations.
Which tool would you use to extract the day of the week from a set of dates?
Explanation
Click "Show Answer" to see the explanation here
Power Query editor allows you to search for data sources and then shape that data. For example, remove a column, change a data type, or merge tables.
Sometimes, your data might contain extra data or have data in the wrong format. Power BI Desktop includes the Power Query Editor tool, which can help you shape and transform data so that it's ready for your models and visualizations.
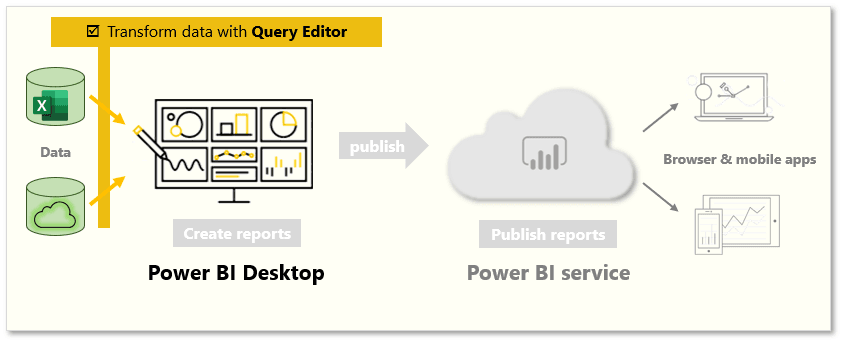
Transform data
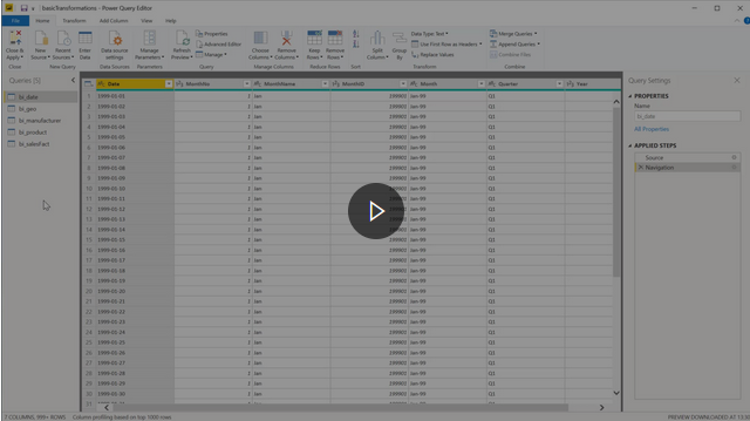
Note: To follow along with the examples in the videos and on this page, download the sample Access database here and import it into Power BI Desktop (Get Data → Database → Access database). If you have any issues loading the Access database, please read this article.
https://www.microsoft.com/en-us/videoplayer/embed/RE3x9uw?postJsllMsg=true
Launch Power Query Editor
To begin, select Transform from the Navigator window to launch Power Query Editor. You can also launch Power Query Editor directly from Power BI Desktop by using the Transform data button on the Home ribbon.
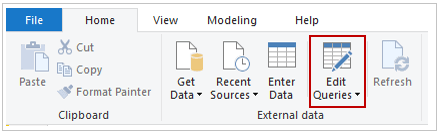
After loading your data into Power Query Editor, you'll see the following screen.
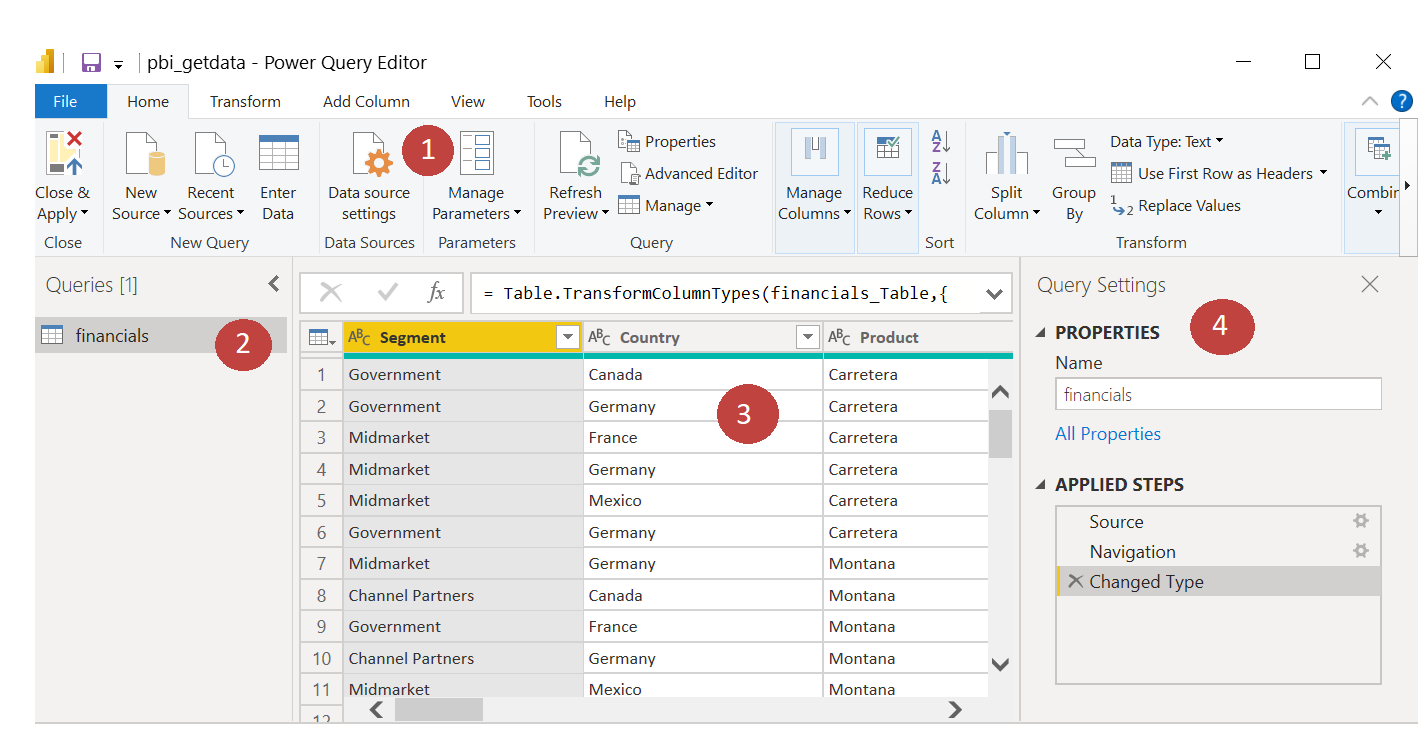
In the ribbon, the active buttons enable you to interact with the data in the query.
On the left pane, queries (one for each table, or entity) are listed and available for selecting, viewing, and shaping.
On the centre pane, data from the selected query is displayed and available for shaping.
The Query Settings window lists the query’s properties and applied steps.
Transform data
On the centre pane, right-clicking a column displays the available transformations. Examples of the available transformations include removing a column from the table, duplicating the column under a new name, or replacing values. From this menu, you can also split text columns into multiples by common delimiters.
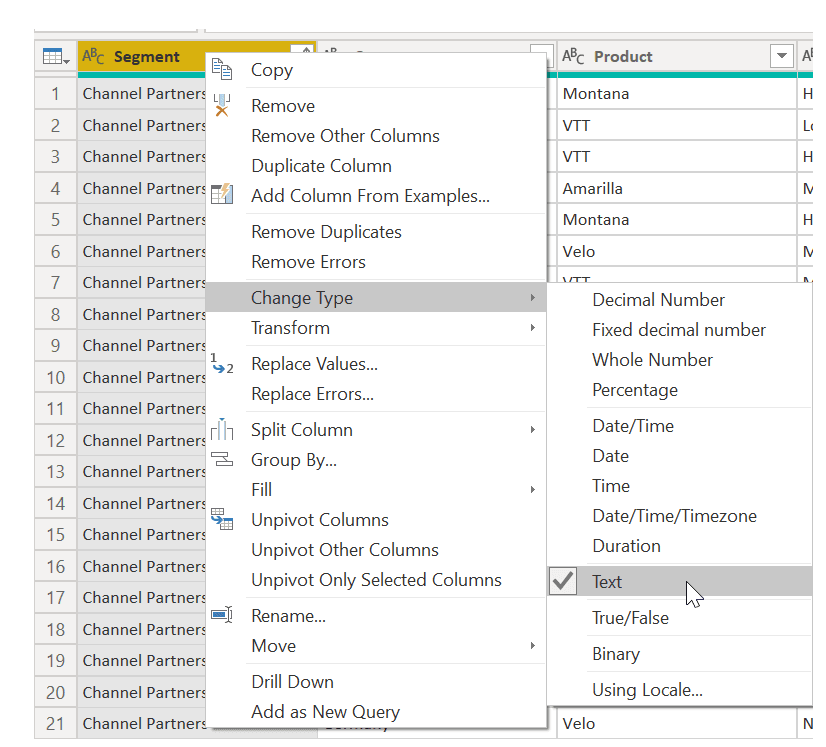
The Power Query Editor ribbon contains additional tools that can help you change the data type of columns, add scientific notation, or extract elements from dates, such as the day of the week.
Tip: If you make a mistake, you can undo any step from the Applied Steps list.
As you apply transformations, each step appears in the Applied Steps list on the Query Settings pane. You can use this list to undo or review specific changes, or even change the name of a step. To save your transformations, select Close & Apply on the Home tab.
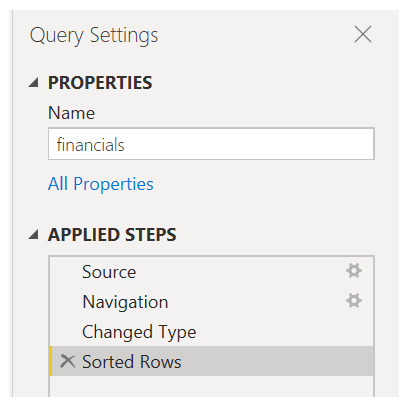
After you select Close & Apply, Power Query Editor applies the query changes and applies them to Power BI Desktop.
Explanation
Power Query editor allows you to search for data sources and then shape that data. For example, remove a column, change a data type, or merge tables.
Sometimes, your data might contain extra data or have data in the wrong format. Power BI Desktop includes the Power Query Editor tool, which can help you shape and transform data so that it's ready for your models and visualizations.
Transform data
Note: To follow along with the examples in the videos and on this page, download the sample Access database here and import it into Power BI Desktop (Get Data → Database → Access database). If you have any issues loading the Access database, please read this article.
https://www.microsoft.com/en-us/videoplayer/embed/RE3x9uw?postJsllMsg=true
Launch Power Query Editor
To begin, select Transform from the Navigator window to launch Power Query Editor. You can also launch Power Query Editor directly from Power BI Desktop by using the Transform data button on the Home ribbon.
After loading your data into Power Query Editor, you'll see the following screen.
In the ribbon, the active buttons enable you to interact with the data in the query.
On the left pane, queries (one for each table, or entity) are listed and available for selecting, viewing, and shaping.
On the centre pane, data from the selected query is displayed and available for shaping.
The Query Settings window lists the query’s properties and applied steps.
Transform data
On the centre pane, right-clicking a column displays the available transformations. Examples of the available transformations include removing a column from the table, duplicating the column under a new name, or replacing values. From this menu, you can also split text columns into multiples by common delimiters.
The Power Query Editor ribbon contains additional tools that can help you change the data type of columns, add scientific notation, or extract elements from dates, such as the day of the week.
Tip: If you make a mistake, you can undo any step from the Applied Steps list.
As you apply transformations, each step appears in the Applied Steps list on the Query Settings pane. You can use this list to undo or review specific changes, or even change the name of a step. To save your transformations, select Close & Apply on the Home tab.
After you select Close & Apply, Power Query Editor applies the query changes and applies them to Power BI Desktop.